CAT: misc
Stock Price
Stock's price and return views are part of the stock's detail analysis. In this section we will show in-depth analysis of stock's price trending and returns.
Date range
User can set a date range by using the date picker. Default end date is TODAY, and start date is 1-month from TODAY.

Default end date is TODAY, and the default range is set to be
30 days back from TODAY. Setting an insensible date range, eg. start
date is greater than the end date, or some distant dates in the
future, will not produce an error. Instead, the backend will return
an empty date set, thus rendering this view blank.
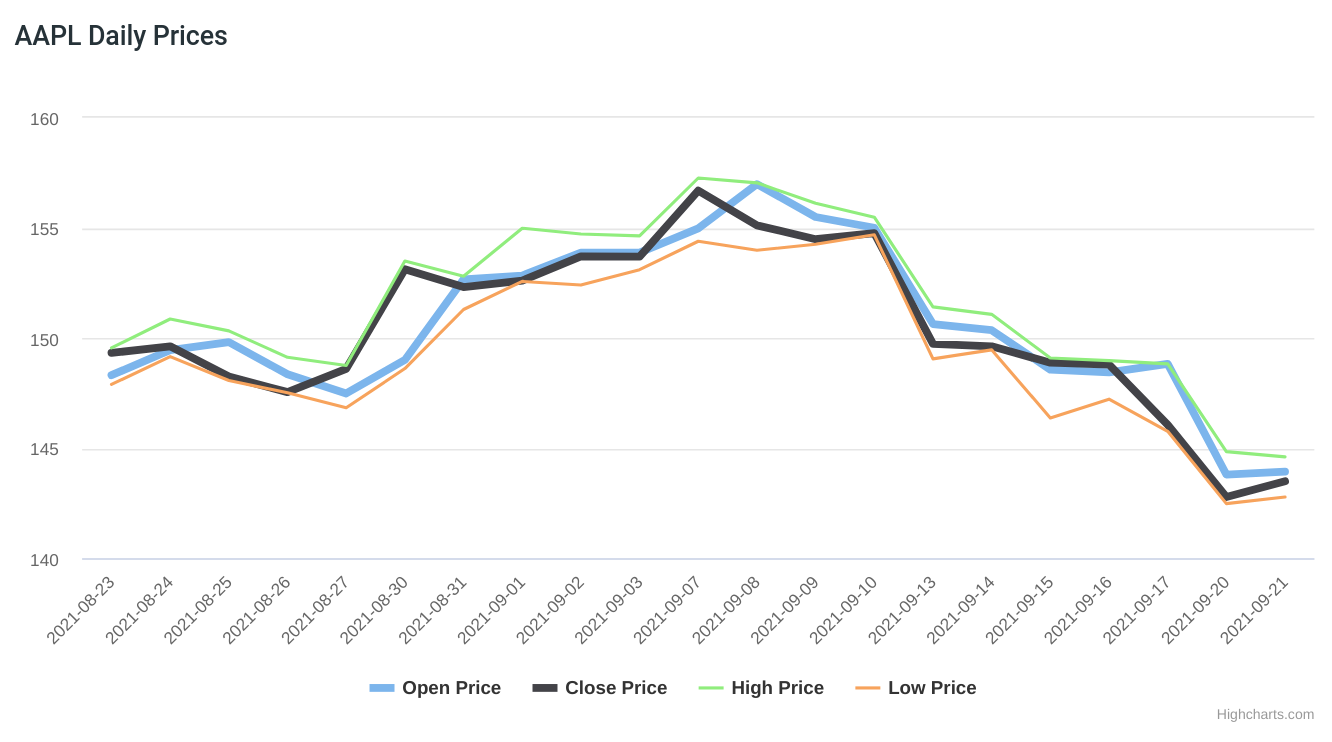
Historical daily price
Price line chart
Price line chart is the quickest way to see how a stock is going. The
chart includes prices of open, close, high and low.
Weekly price chart
The weekly price chart breaks down price over the selected date range so to zoom into each week's performance as well as each …