We offer analysis of four valuation methods: DuPont ROE model, discounted cash flow model, valuation ratios such as P/E, P/B, and net asset value.
DuPont ROE
DuPont ROE model is "a useful technique used to decompose the different drivers of return on equity (ROE)". In a nutshell it breaks down a single ROE value into three components:
- net profit margin %: Some businesses are by nature high profit margin but small volume, such as a luxury brand, while others are the opposite, eg. WalMart. Thus a trend of this aspect shows whether the business is performing as expected, or has shifted its strategy.
- asset turn over %: Wholesale business such as WalMart often rely on thin margin but large volume, thus shows a high asset turn over rate.
- equity multiplier: In other words, debt leverage over equity. Borrowing power is a magnifier, and it works both ways.
Yahoo! API provides a latest ROE value. However, our tool take this one step further by computing the ROE value of each reporting period. By doing so the tool also shows how the ROE value and its DuPont factors change over time. Thus the user gets a sense how the business is growing or deteriorating.

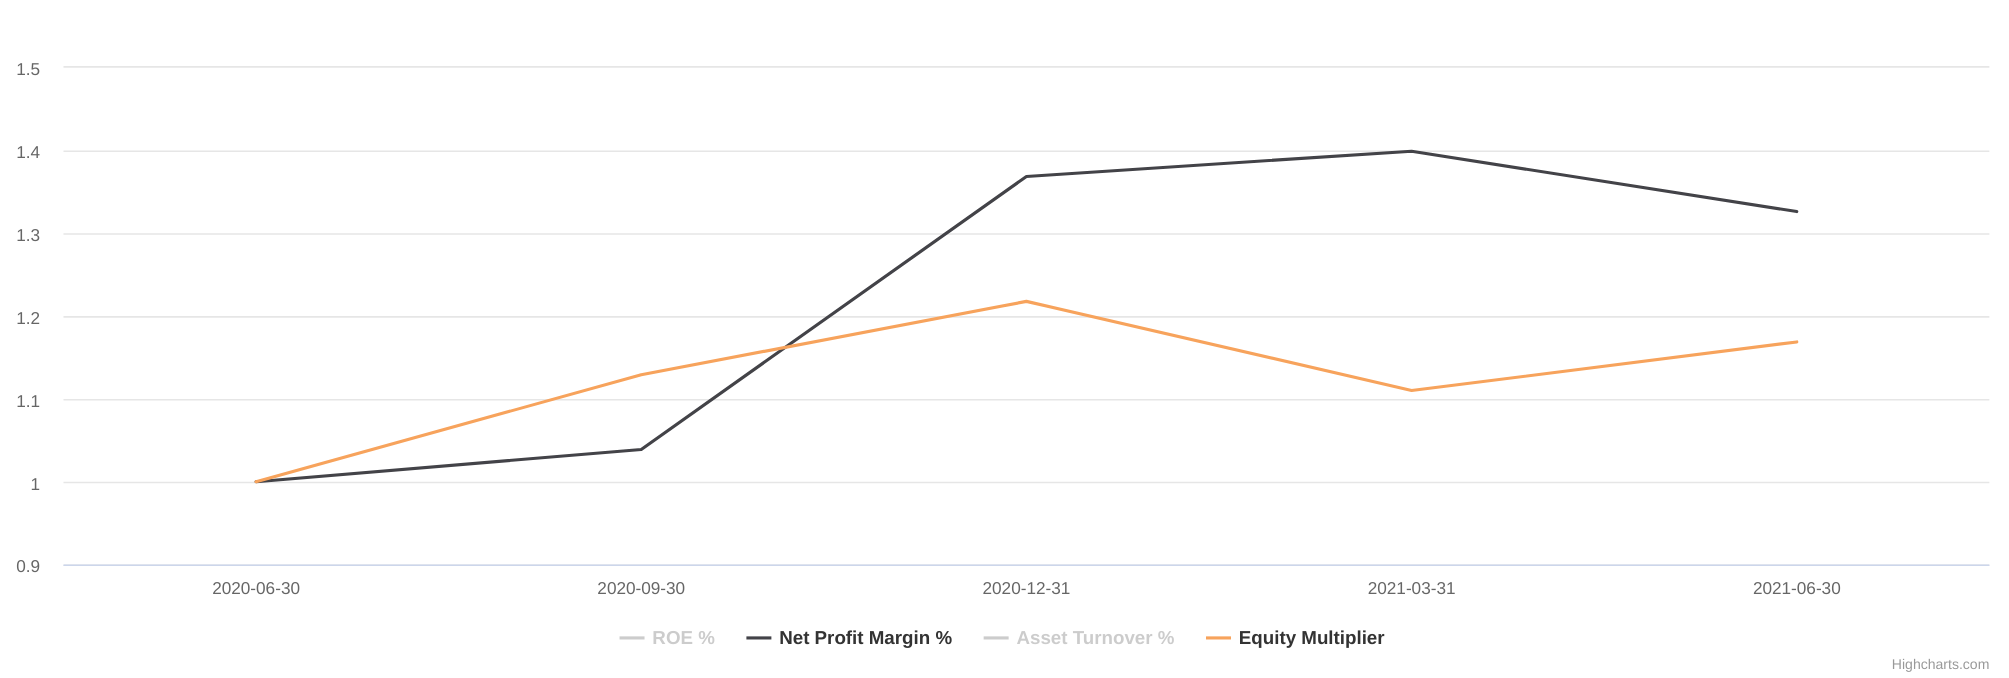
In the example, AAPL's ROE (blue) jumped based on the 3/31/2021
reporting data. DuPont model shows that its profit margin and debt
leverage didn't change much, and the drive of this jump was mainly by
an increase of asset turnover rate (green). Further, if we examine the
net profit margin vs. the debt leverage, we would see that the debt
leverage was growing from 1 to 1.2, while the net profit margin grew
even quicker from 1 to 1.3. Now to think of it, if AAPL had a
higher margin, an explosive volume, and not taking on much debt, I
would say its business is in a good shape by this valuation.
Discounted Cash Flow (DCF)
DCF model is a fairly complex one. There are many assumptions involved, each could have throw off the estimation significantly into insensible land. Here we are not to offer a better DCF number. Rather, it is to give user the power to tweak and test these assumptions and see their effect on the estimation, thus allowing user to test his methods as well as honing his understanding w/ quick feedbacks.
Another thing worth noting is many of the DCF templates/tools on the web use average to smooth out sales or cash flow and so forth, and usually provides a single DCF value in the end. Ours, instead, computes per each reporting period using its reported data only. Due to the data quality of our data source, some stocks may have a missing data point in a reporting period. In this case, we look back for the closest reporting period that can provide this value and use that. All these would introduce distortion to the estimation. However, as a modeling tool, we think the benefit of being able to see the estimation changes over time outweighs the tradeoffs.

- risk free rate: Default
1.242%. However, one should look up the published Treasury Rates for an up-to-date value. - project years: Default
5, meaning we are projecting its sales for these many years. There is also an underline assumption that the business would exist for this long. - growth rate: Projected free cash flow growth rate per
year. Default to
7%. - terminal growth rate: Default to
1%. The DCF model is sensitive to this value. - market premium: Default to
7%. - cost of debt: Default to
10%.
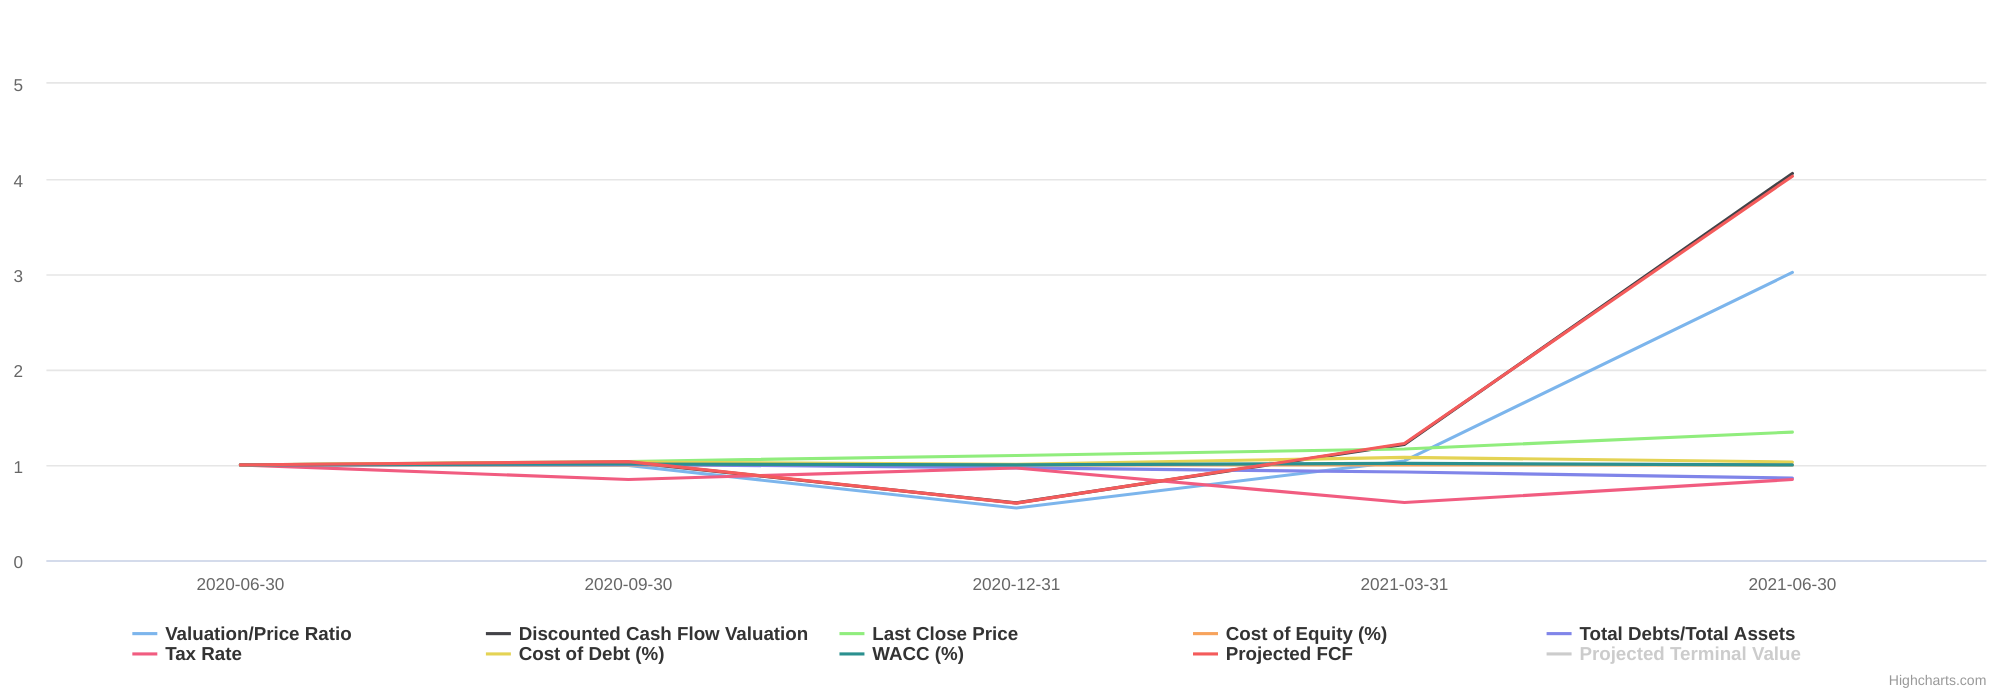
Changing any of these assumptions would refresh both the chart and table w/ newly computed values. As our practice, the chart is drawn w/ data normalized, thus showing both their relative strength to each other, and a trend over time.
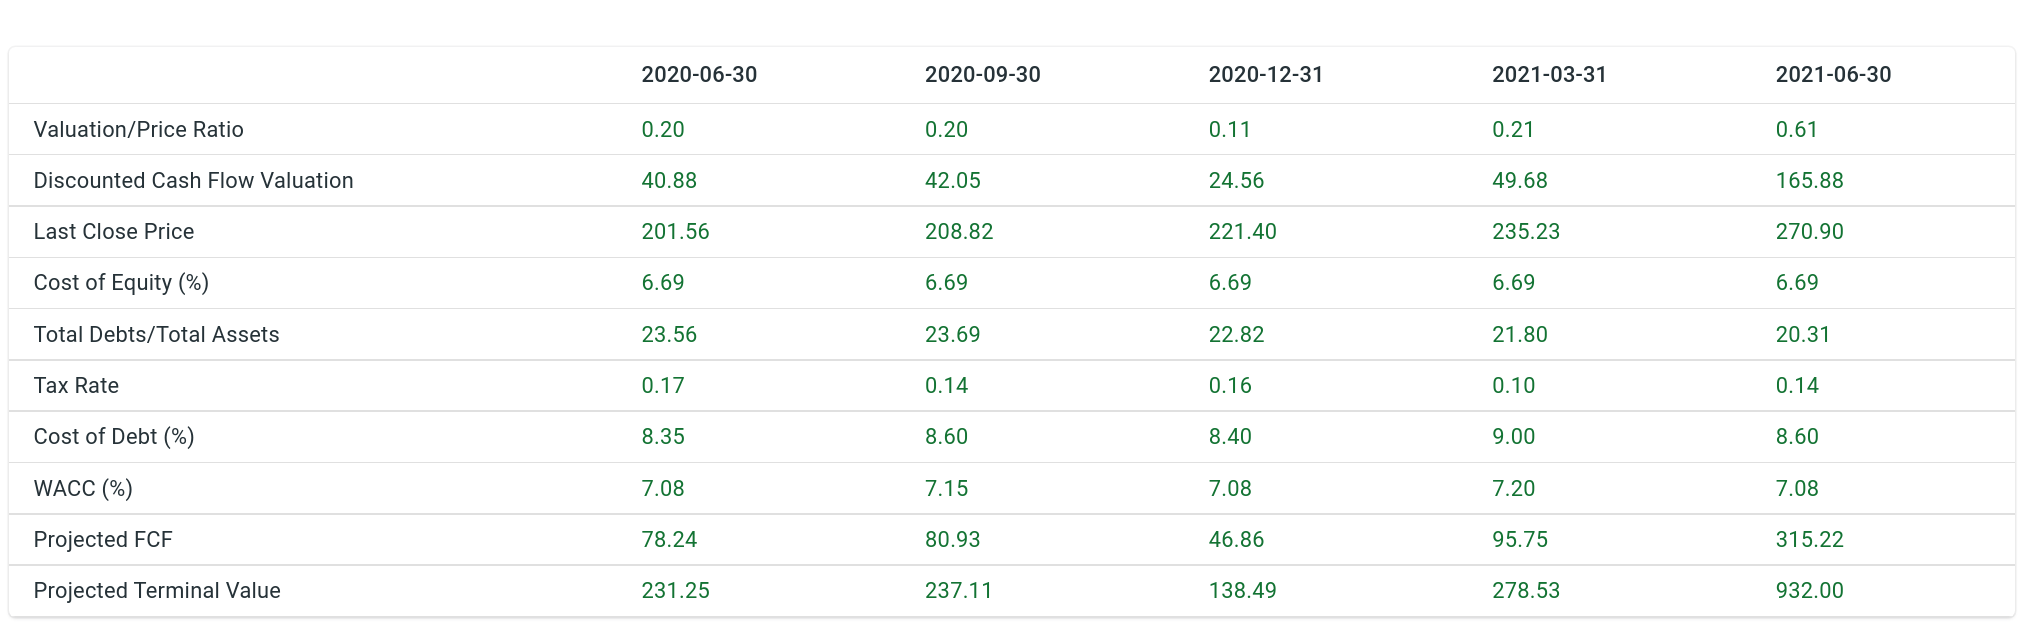
In the table, we list all the values used in this valuation, thus allowing user to further verify and investigate, for example, for outlier values based on his own judgment or knowledge. Most of the values are self-explanatory. A few are discussed below:
| Value | Description |
|---|---|
| Last Close Price | The close price on the reporting date |
| Discounted Cash Flow Valuation | Estimated DCF price |
| Valuation/Price Ratio | DCF price / last close price |
| Cost of Equity | risk free + (beta * market premium) |
We assume a constant cost of equity. This is obviously
inadequate. However, since we do not yet allow changing risk free
rate, beta and market premium per reporting period, this value is used
in all periods' estimation. This will be improved in future releases.
The valuation/price ratio is meant to show how well the DCF
estimation was compared to the actual market. A value greater than 1
means DCF was more optimistic than the market, and a value less than 1
is the opposite. Therefore, by testing different assumptions, the tool
provides a feedback loopto the user how likely his assumptions
were approximating the actuality. Market may not be always right. But
it's being very wrong is rare, also.
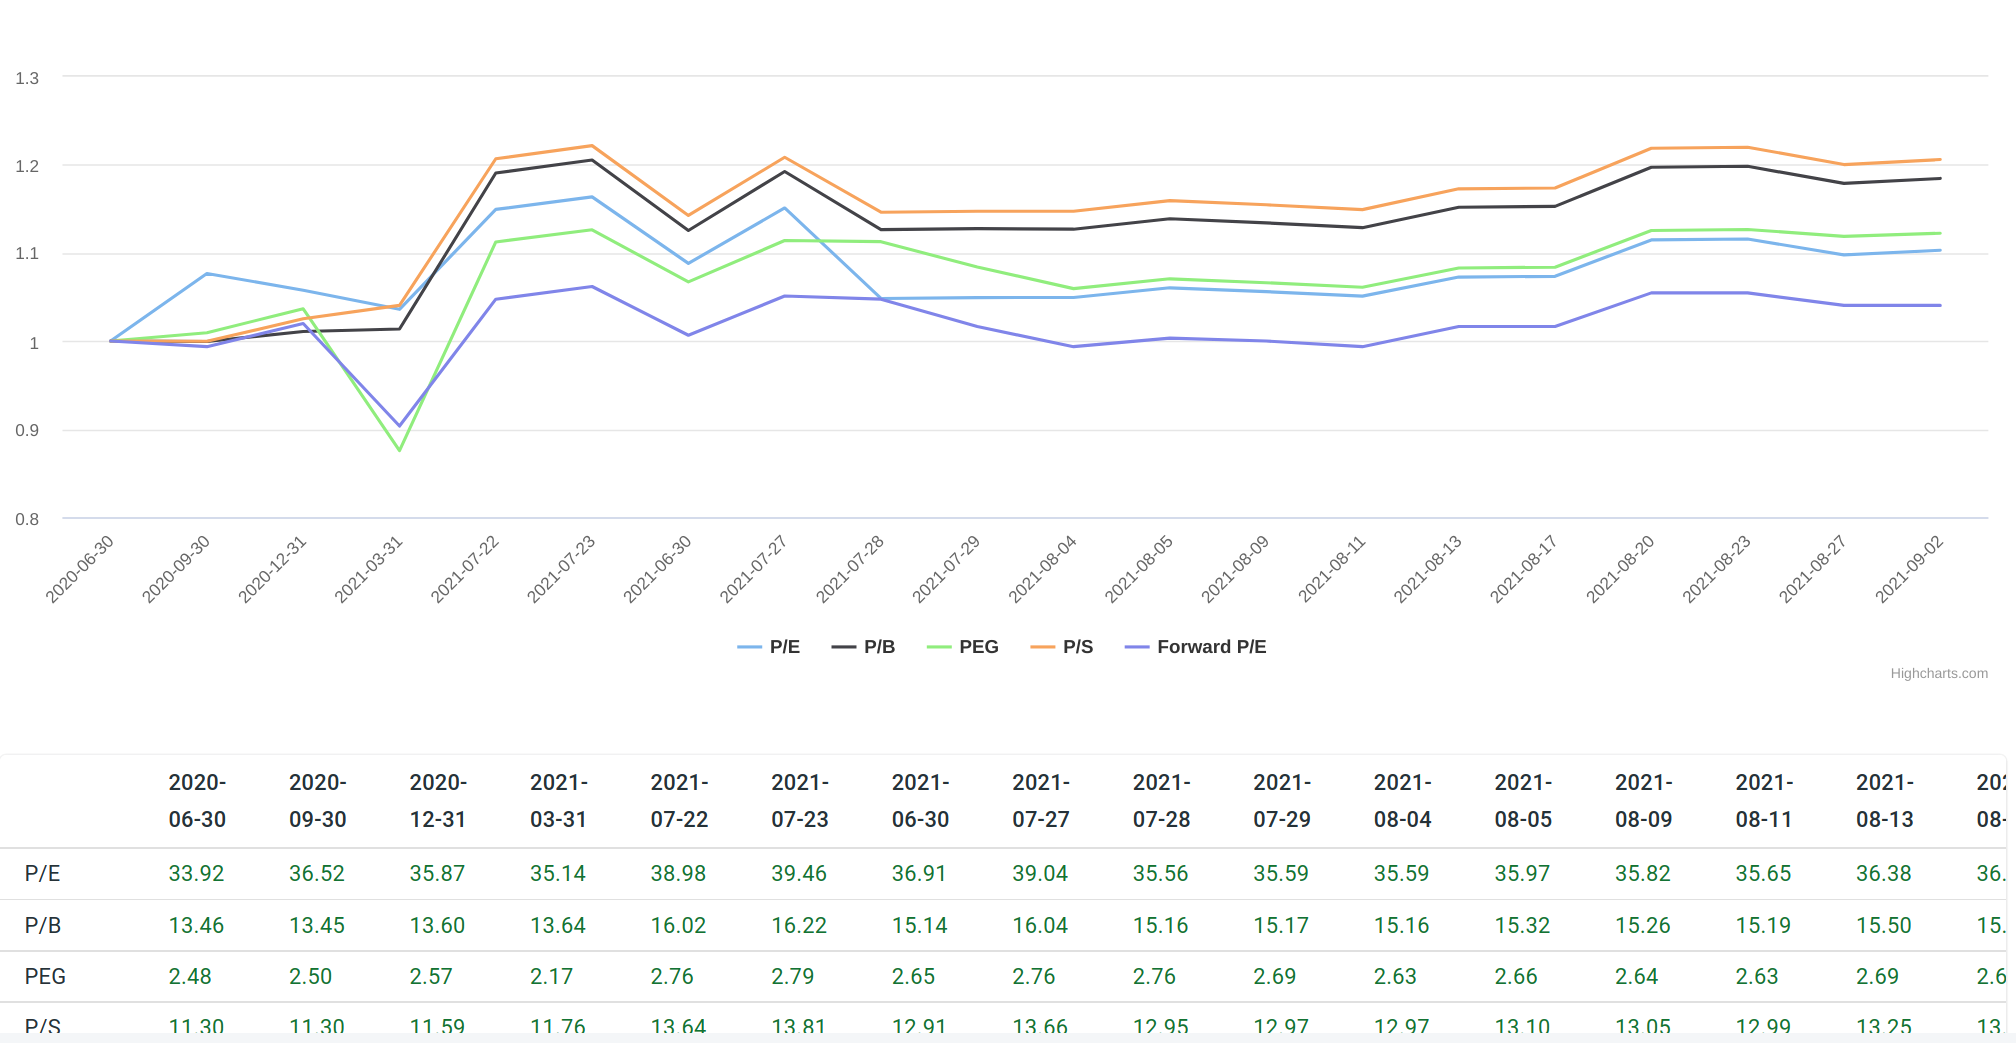
Valuation Ratios
These valuation ratios are published by the data source. Thus, here the tool simply present them as reported.
Net Asset Value (NAV)
These values are published by the data source.
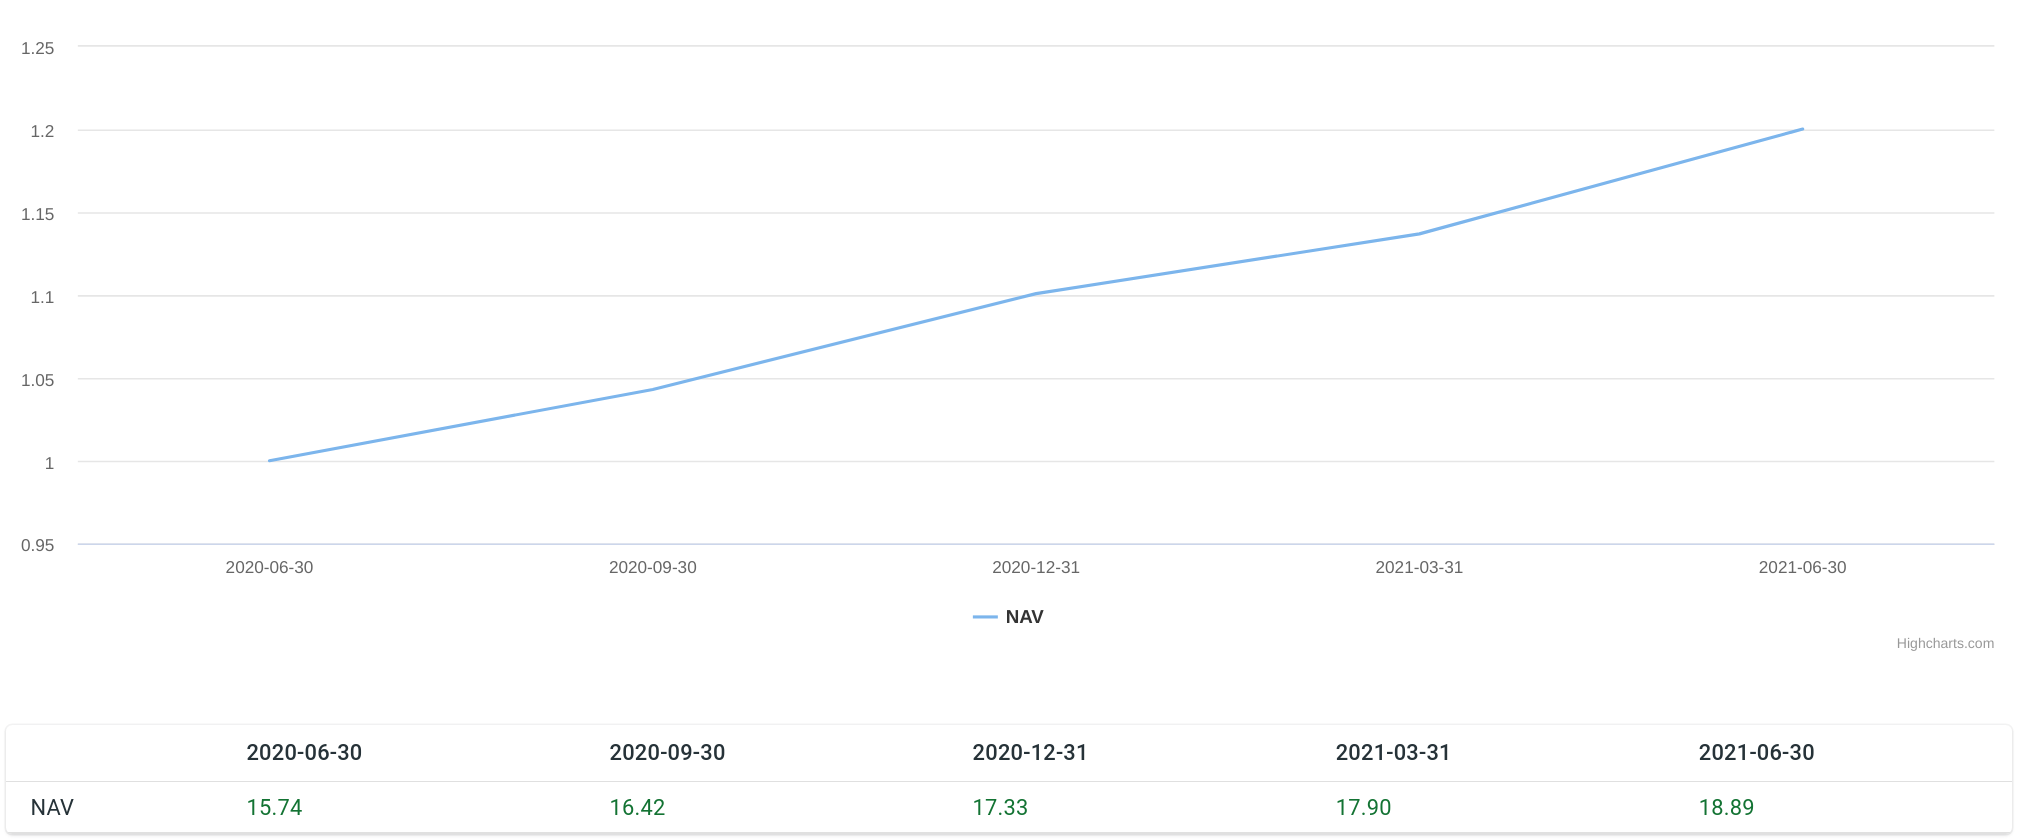
-
These values are normalized as 1 being the base. ↩
— by Feng Xia