Stock's price and return views are part of the stock's detail analysis. In this section we will show in-depth analysis of stock's price trending and returns.
Date range
User can set a date range by using the date picker. Default end date is TODAY, and start date is 1-month from TODAY.

Default end date is TODAY, and the default range is set to be
30 days back from TODAY. Setting an insensible date range, eg. start
date is greater than the end date, or some distant dates in the
future, will not produce an error. Instead, the backend will return
an empty date set, thus rendering this view blank.
Historical daily price
Price line chart
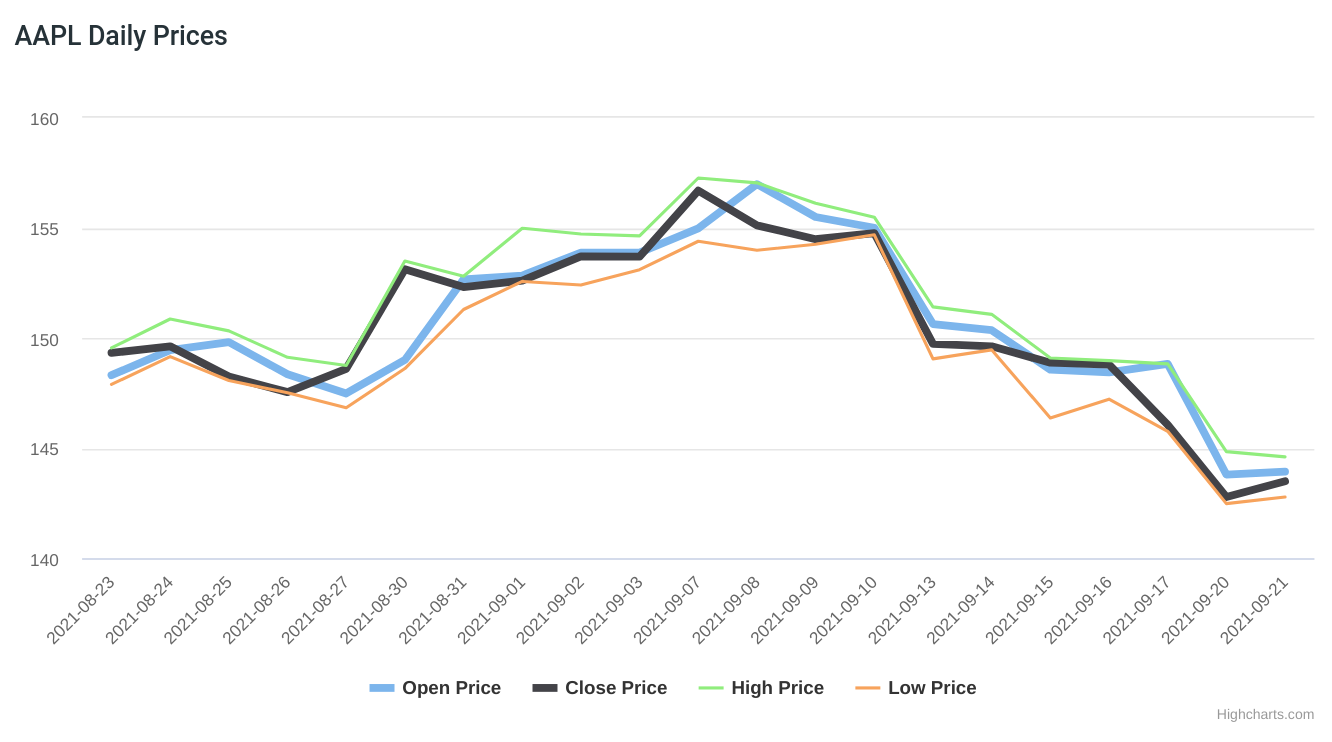
Price line chart is the quickest way to see how a stock is going. The
chart includes prices of open, close, high and low.
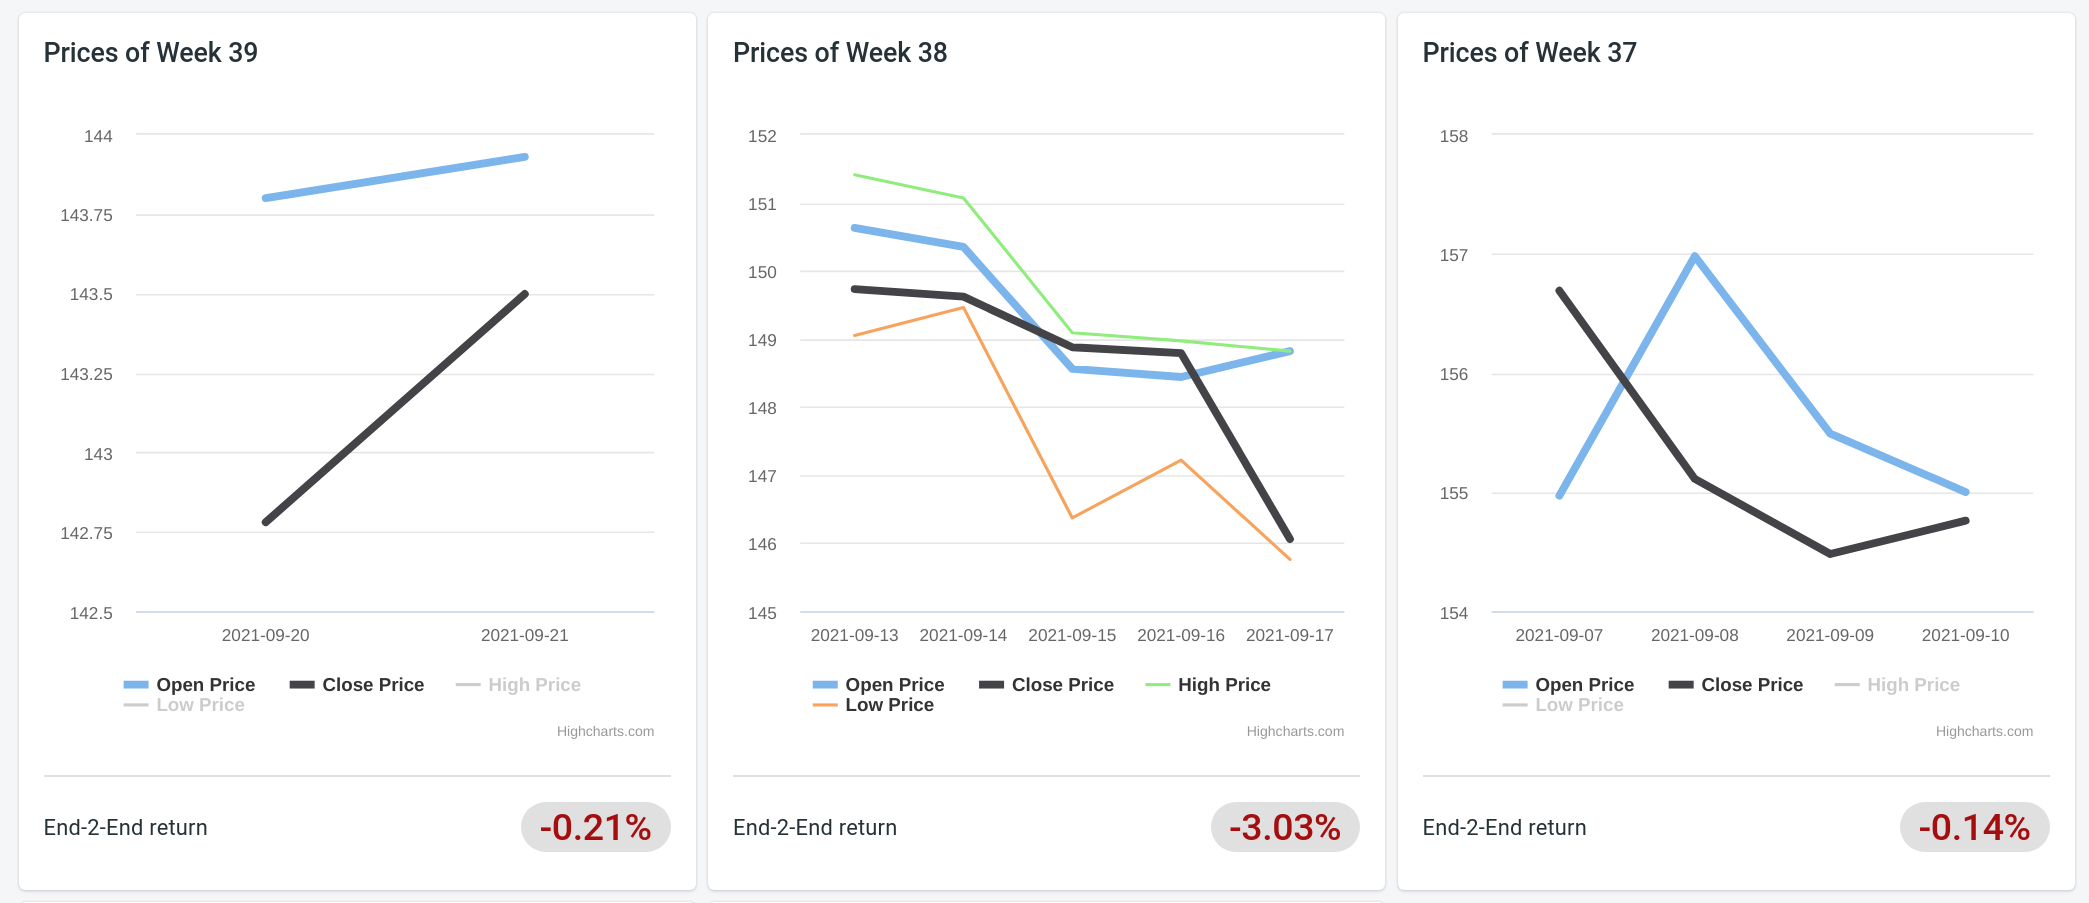
Weekly price chart
The weekly price chart breaks down price over the selected date range
so to zoom into each week's performance as well as each week's
end-2-end return = (week's close - week's open)/week's open. Like
all other charts, clicking legends will toggle a data set on/off.
Gain probability ranges
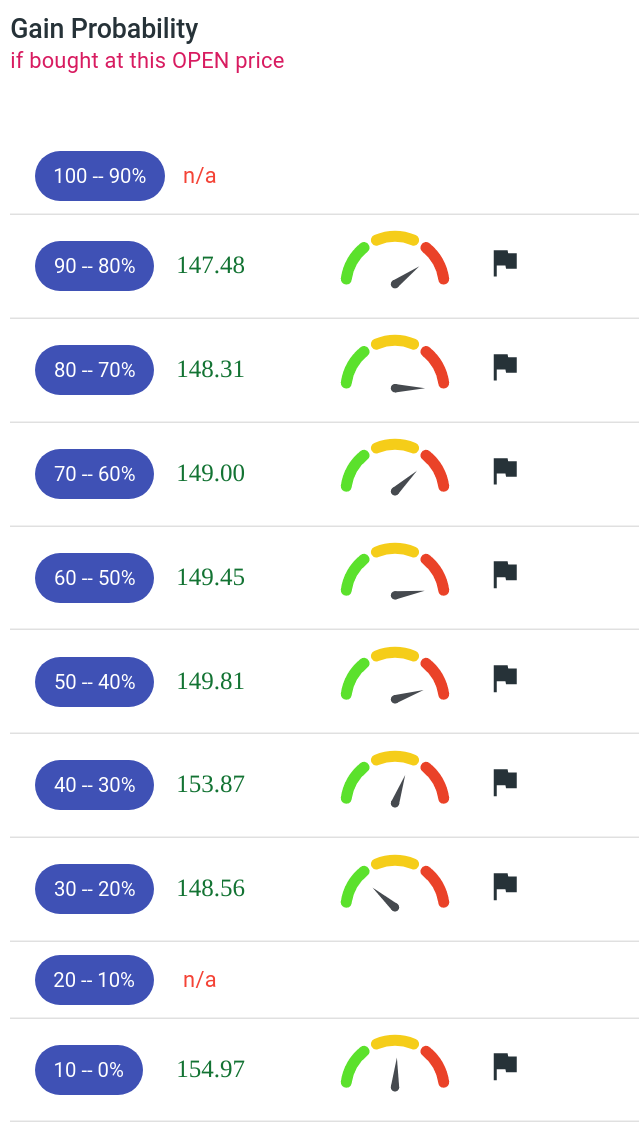
The gain probability range is to address this common question — if I buy stock at this price, how likely I would make a positive return? To answer this, we create 10 ranges over 0-100%. Then we would use each day's price to estimate which range its probability will fall into.
-
percentage: The percentage measures the total likelyhood you will get a positive return counting day by day. Taking a historical, pretending we can look into the future (thus we have a God's view), counting days when you could make a gain w/ a higher price. The percentage of this count vs. the total days elapse from this date represents a probability. For example, if there are 10 days out of 30 days this one could have made a gain on this current price, the probability will be
10/30=33%. -
open price: This is the minimal
open priceyou could have purchased to achieve the percentage above. Continuing the example above, if there were 10 days one could have made a positive return, we sort and display the lowest open price, thus assuming you would have paid the least for such a gain probability. An/ameans no price could have achieved such probability1. -
time window gauge: Time window is the days left if you made purchase on a day. For example, buying at $148.56 (the
30-20%probability one) would have less trading days left for you to get out, than buying at $153.87 (the40-30%probability one). The best pattern would be a high probability and a long trading window to realize such probability. -
the TODAY-is-cheaper flag: The flag uses the latest known
closeprice (as a proxy to the SPOT price) to compare with the suggestedopen priceabove. If thecloseis less than theopen, it puts a flag indicating the current price is more attractive than theopenwe saw before2.
It may now seem pointless why one would care such probability at all if it tells no future. However, these probabilities give you a reference point against current price so you get a sense of how it had (or could have) behaved.
-
WARNING: We choose
openpretending you are buying it on the beginning of day. Of course, the actual purchase price would be different. So this price value is more of a sense how well it will fare instead of being a precise point to act upon. ↩ -
WARNING: This is not a guaranteed winner because the stock price may be on a sliding trend, thus a lower price now doesn't warrant you would be able to realize the gain even. For example, if the
closeprice is today's, the probability is only testifying that such price could have made gains in the past, but has no predicting power whatsoever. ↩
— by Feng Xia