Now with each stock having an army of indexes computed from its price, statements and so on, one's ultimate goal is to use them to select the good stock. Instead of building a complex filter, we simplify the picking by ranking stocks along these indexes, and provide a rich feature using these rankings to help you verify your stock picking strategy.
Overview
There are five categories of data point we are providing:
- by ROE analysis: reported ROE, DuPont ROE
- by balance sheet analysis
- by income statement analysis
- by cash flow statement analysis
- by valuation ratios: P/E, P/B, P/S
Ranking could be from high-to-low or low-to-high depending on the
meaning of that particular index. For example, for current ratio,
higher is better, thus it is ranked from high to low, whereas for
debt growth rate, we view a growing debt negatively, thus it is
ranked low to high.
WARNING: Due to stocks having different reporting periods, there isn't an alignment to compare A's balance sheet on date XYZ w/ the B's on the same date — the data were simply not available. Therefore, these ranking values are using the latest one in our data source.
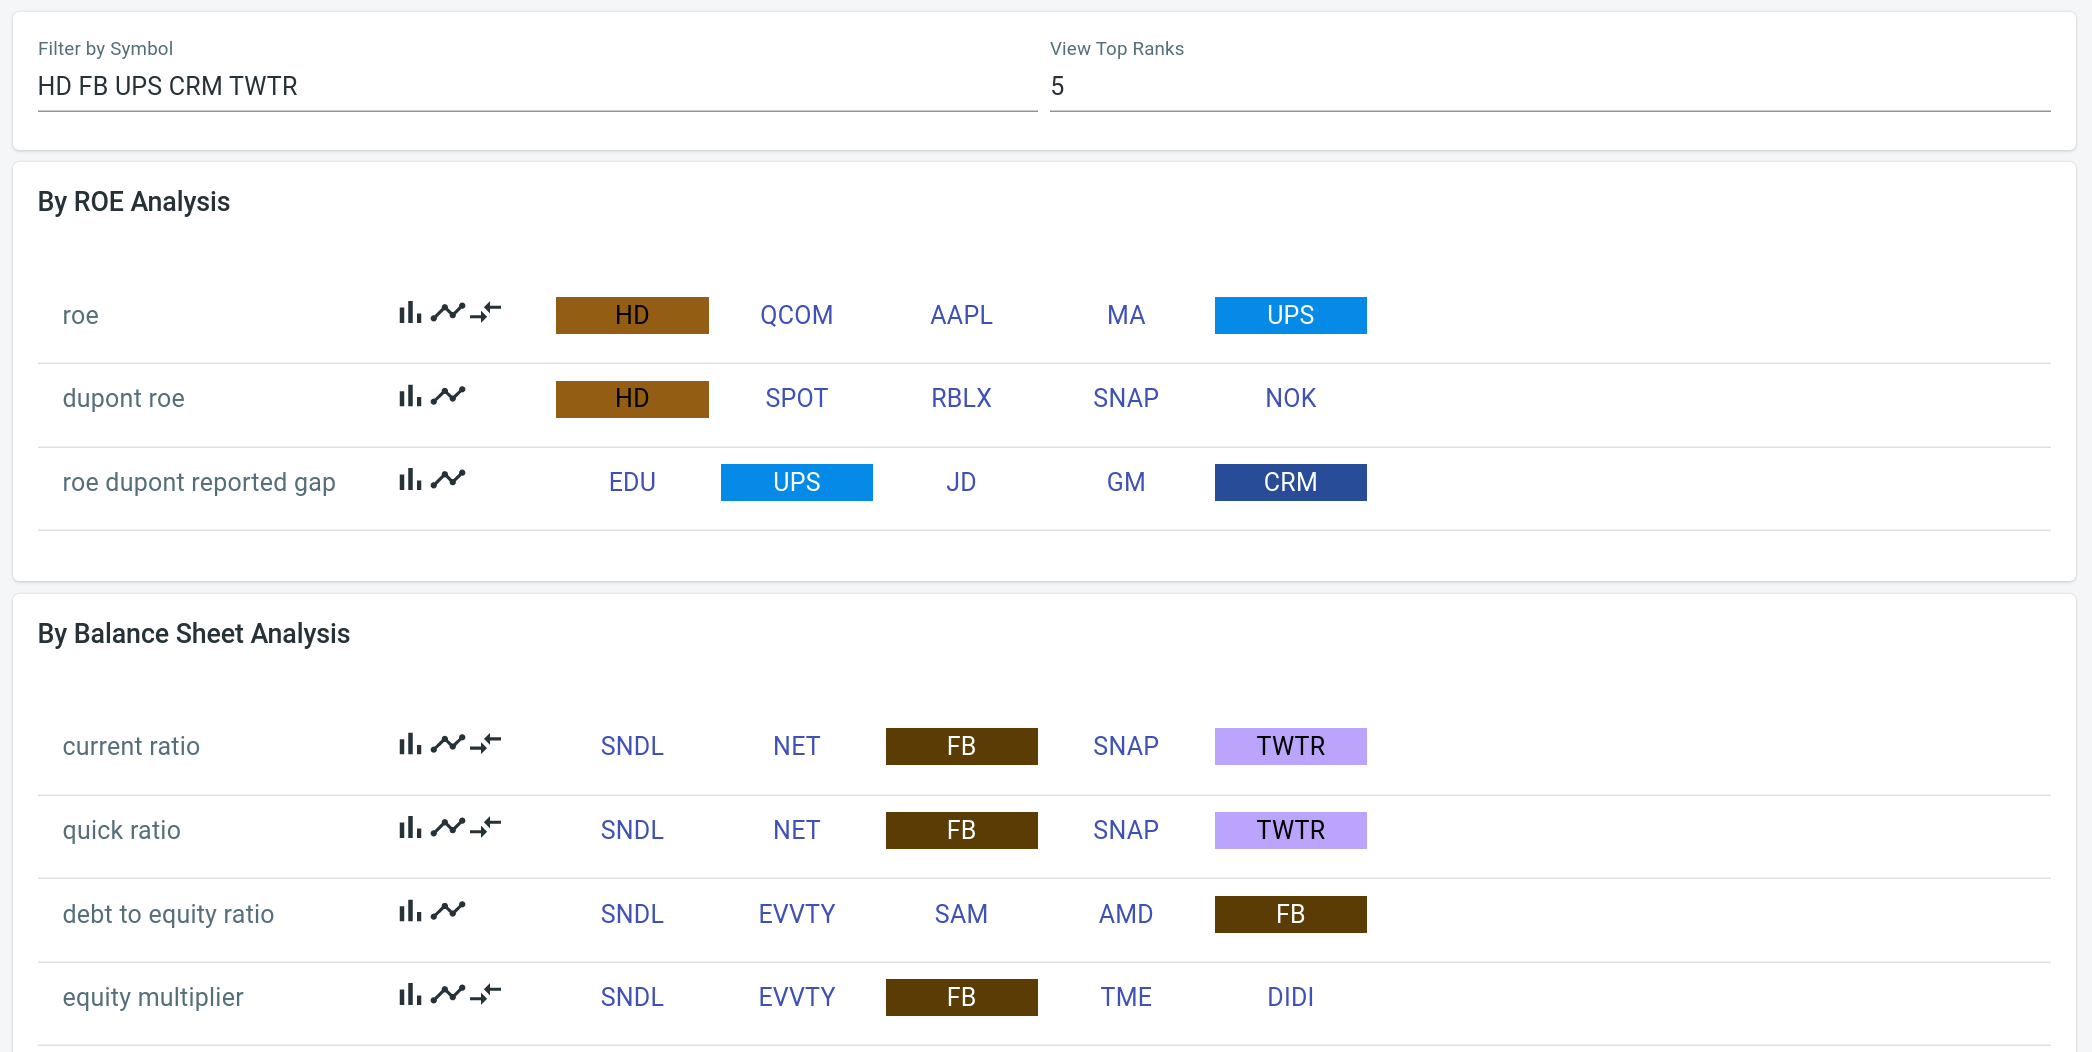
Color coding & top ranks
There are two controls on the top of the page where user can set to bring more information to light: filter by symbol, and top ranks.
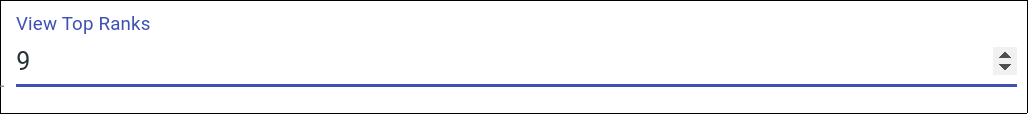
Set top ranks
By default we show the top 5 of each index. User can use the _top ranks` control to adjust this, for example, to view top 10. The max is limited by how many stocks you have added in your portfolio.

NOTE that rankings are computed on the fly. Therefore, the higher this number is, the more computation load it presents to the tool. So it will be much longer to show a top 20 than to show a top 3.
Color coding
Color coding is a great feature to visualize how a stock is positioned according each ranking. Instead of viewing all ranked stocks generally, user can input a list of stock symbols using space delimited or comma delimited format, and the symbol will be automatically assigned a color for visual highlight.
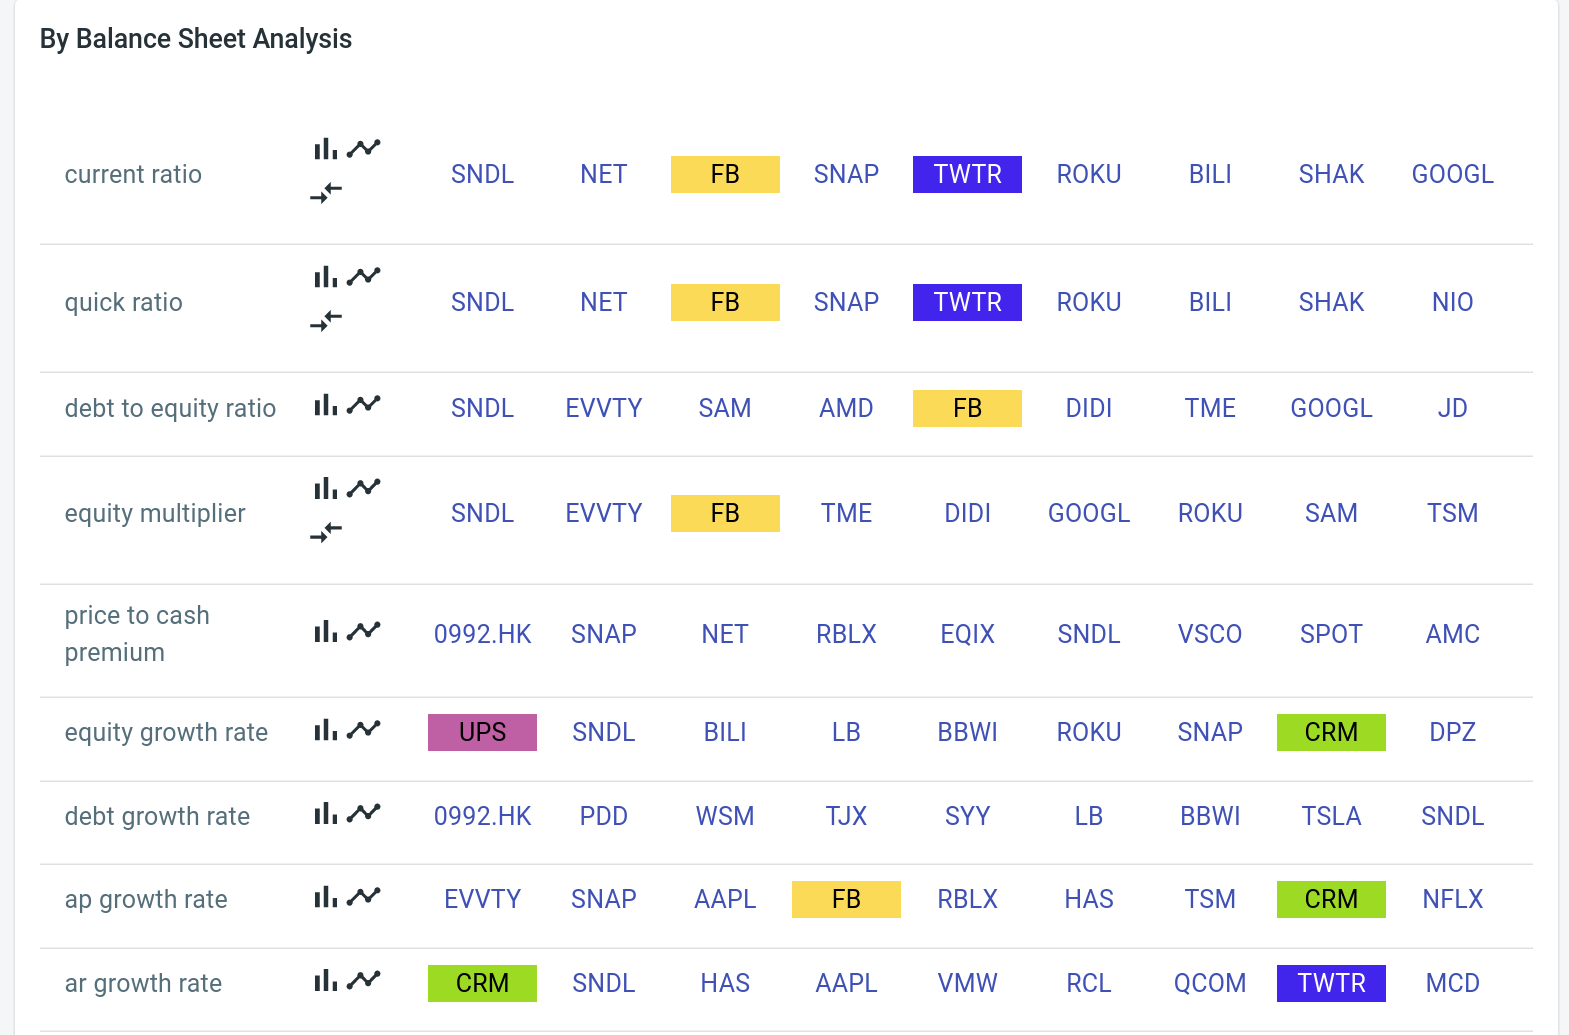
In this example, UPS ranked the best for equity growth
rate. However, it didn't make the top 9 for any other indexes. FB,
by contrast, ranked well for most of the balance sheet indexes, but
also missed on the debt growth rate list (for better or worse).
Ranking
Each ranking provides a list of controls which mean to provide context to the ranks. From left to right, they are: rank bar chart, price comparison chart, and value threshold.
Rank bar chart
When to research these ranks, we want to see how the values are relative in strength to each other. There are two ways to get the values: hovering mouse over the stock symbol, or show the rank bar chart. Clicking the bar chart control will toggle.
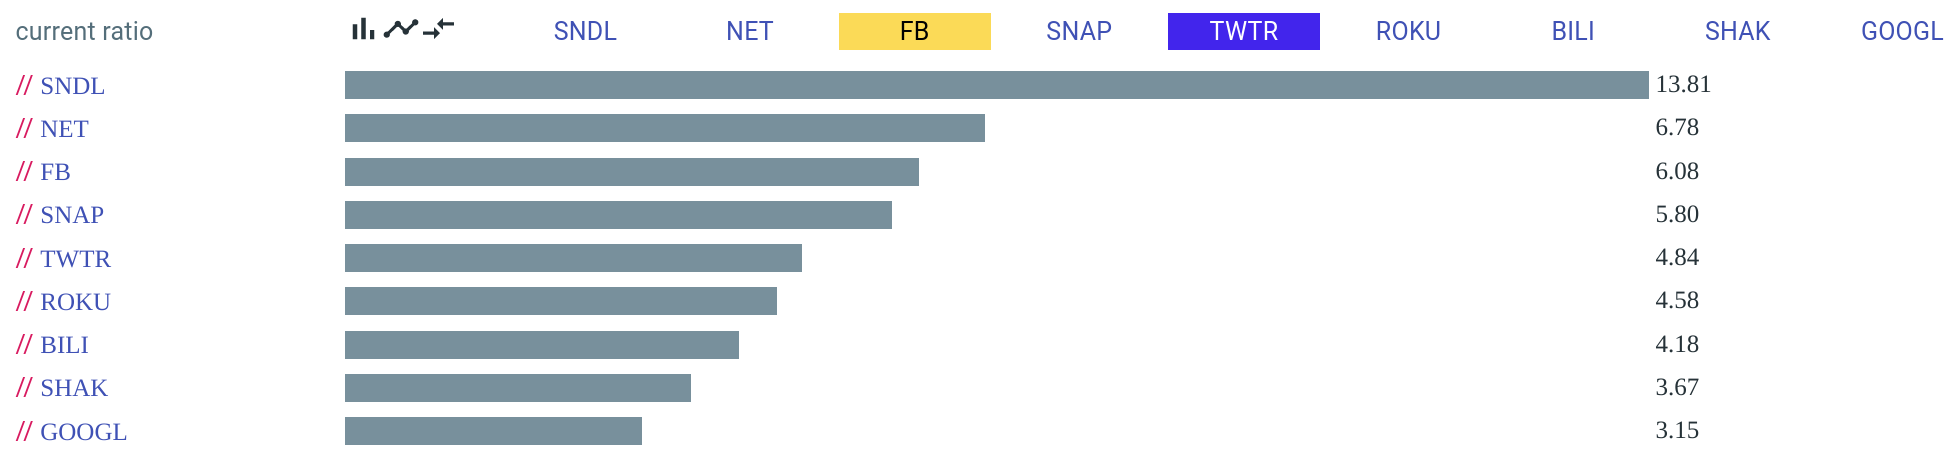
Here in this example, we now see not only the rankings in order, but a
sense of strength in this side-by-side comparison. NET's current
ratio is 6.78, about 1/2 of the SNDL's, thus is a distant second
by this measure.
Price comparison chart
Viewing a rank often leads to the question whether this rank is reflected in the stock's performance. By showing the price of these stocks over the last 30 days, user can examine how the price is corresponding to this particular index. In our view, this is a great way to test a theory (or dismiss a myth) that "stock A is better than stock B because it has a better [fill in an index name]".

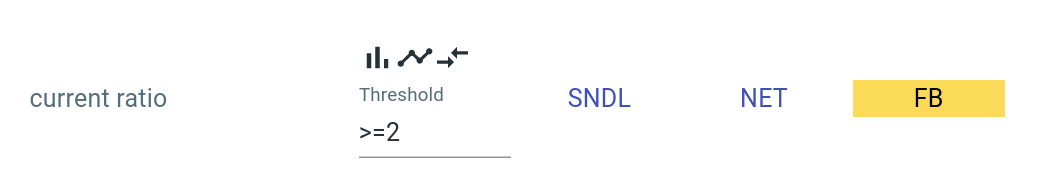
Value threshold
For some indexes we have also implemented value threshold. We support
equation of > (greater than), >= (greater than or equal to), <
(less than), and <= (less than or equal to). User can use these
thresholds to further narrow down the ranking list for
research. NOTE that these thresholds are not saved once you leave
the page.
— by Feng Xia