Disclaimer, philosophy
First of all, this isn't a magic tool to beat the market. We firmly believe the final conclusion should be drawn by the user whose brain power holds the edge over the market, if ever.
The purpose of this tool is to assemble information in a fashion to assist the user process these information more efficiently by liberating his/her from tedious, but necessary, steps such as data collection, ratio computation, drawing a line graph, etc., than without such a helper. Thus with this tool, the user could focus onto creating value instead of being bogged down by less value-added works.
Audience & goals
This application is written for users who have interest in the stock market, in particular, data analysis of the stock data. In my experience, there are five levels of users:
| Type | Tool | Audience |
|---|---|---|
| 1 | apps & websites | Satisfied with the published info |
| 2 | Excel | Think they have some data/info analysis edge |
| 3 | Excel + VBA | Automate routine computation and data assembly |
| 4 | Script or lib | Programmer who gained more computation power over Excel |
| 5 | Commercial | Professional, sky is the limit, membership |
If you are type 5, you probably have advanced tool & knowledge for the work.
But if you are type 1-4, you can have now more computing power and better user experience at hand. A common pattern/workflow these users follow:
- Obtain raw data
- Crunch of his own indicator or measure using these data
- Draw a graph here and there to visualize his results
- Search for pattern, signal, clue...
Challenges & Values
It's always easier said than done. If you echo the work pattern listed above, you would also recognize the challenges, thus the values this tool is hoping to create.
Getting data
Surprisingly it is rather difficult to find a free data source for stock data. For this tool, we have opted to use the Yahoo! finance API, and in particular, the yahooquery library, as the data source. If you have access to other data, the tool can be easily extended by TBD: write plugin;
A value of this tool is to handle API of available data sources so to retrieve available raw data.
Cleansing data
Data quality is the next challenge. By establishing a solid data model in the backend, the tool takes care of cleansing and normalizing the data before serving them for consumption. Headaches such as missing data points, divided by zero exception are handled as much as possible by the tool.
2nd value of this tool is to normalize these data points, and potentially amending missing data by providing reasonable default.
Computation of ratios, percentages
In stock analysis, straight-off-the-SEC-report data, such as a sales
figure, is less interesting than comparisons. For example, it's less
useful to know that AMZN's last reported sales was 68B than to know
that the sales grew or shrank by 8%2 over this period. Further, one
can now see other questions to ask, such as whether the 8% is lower
or higher than AMZN's average, or its peer's... and so on.
Further, any financial book or blog has a long list of ratios calculated from reported values, and many of these ratios are not readily available by just looking at Yahoo! or Google. Therefore, they often require the user to do the computation themselves.
In this tool, we have included many of the ratios, percentages, and side-by-side comparisons so to ease the pain.
Therefore, 3rd value of this tool is to provide some computed values out of box. One beauty of historical data is that they don't change. Therefore, a pre-calculated result is as good as new.
RESTful ready
The backend readily serves a RESTful API. Thus it is ready to integrate with another toolchain of your choice. We strive to provided a good user experience w/ our frontend implementation. However, we also anticipate that needs vary.
See the [API doc][] for details.
System design
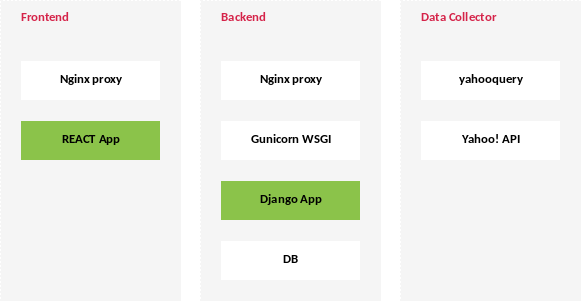
System is split into backend and fronend. Backend is a Django app w/ exposed REST API using Tastypie. Frontend is React.
Primary data source is Yahoo's financial data. In particular, I'm pulling these:
- historical stock daily prices — high, low, open, close, volume
- financial statements — balance sheet, income statement, and cash flow statement
- published meta — beta, P/E, and so on. Since these are opinionated, Yahoo is just one of many alternatives.
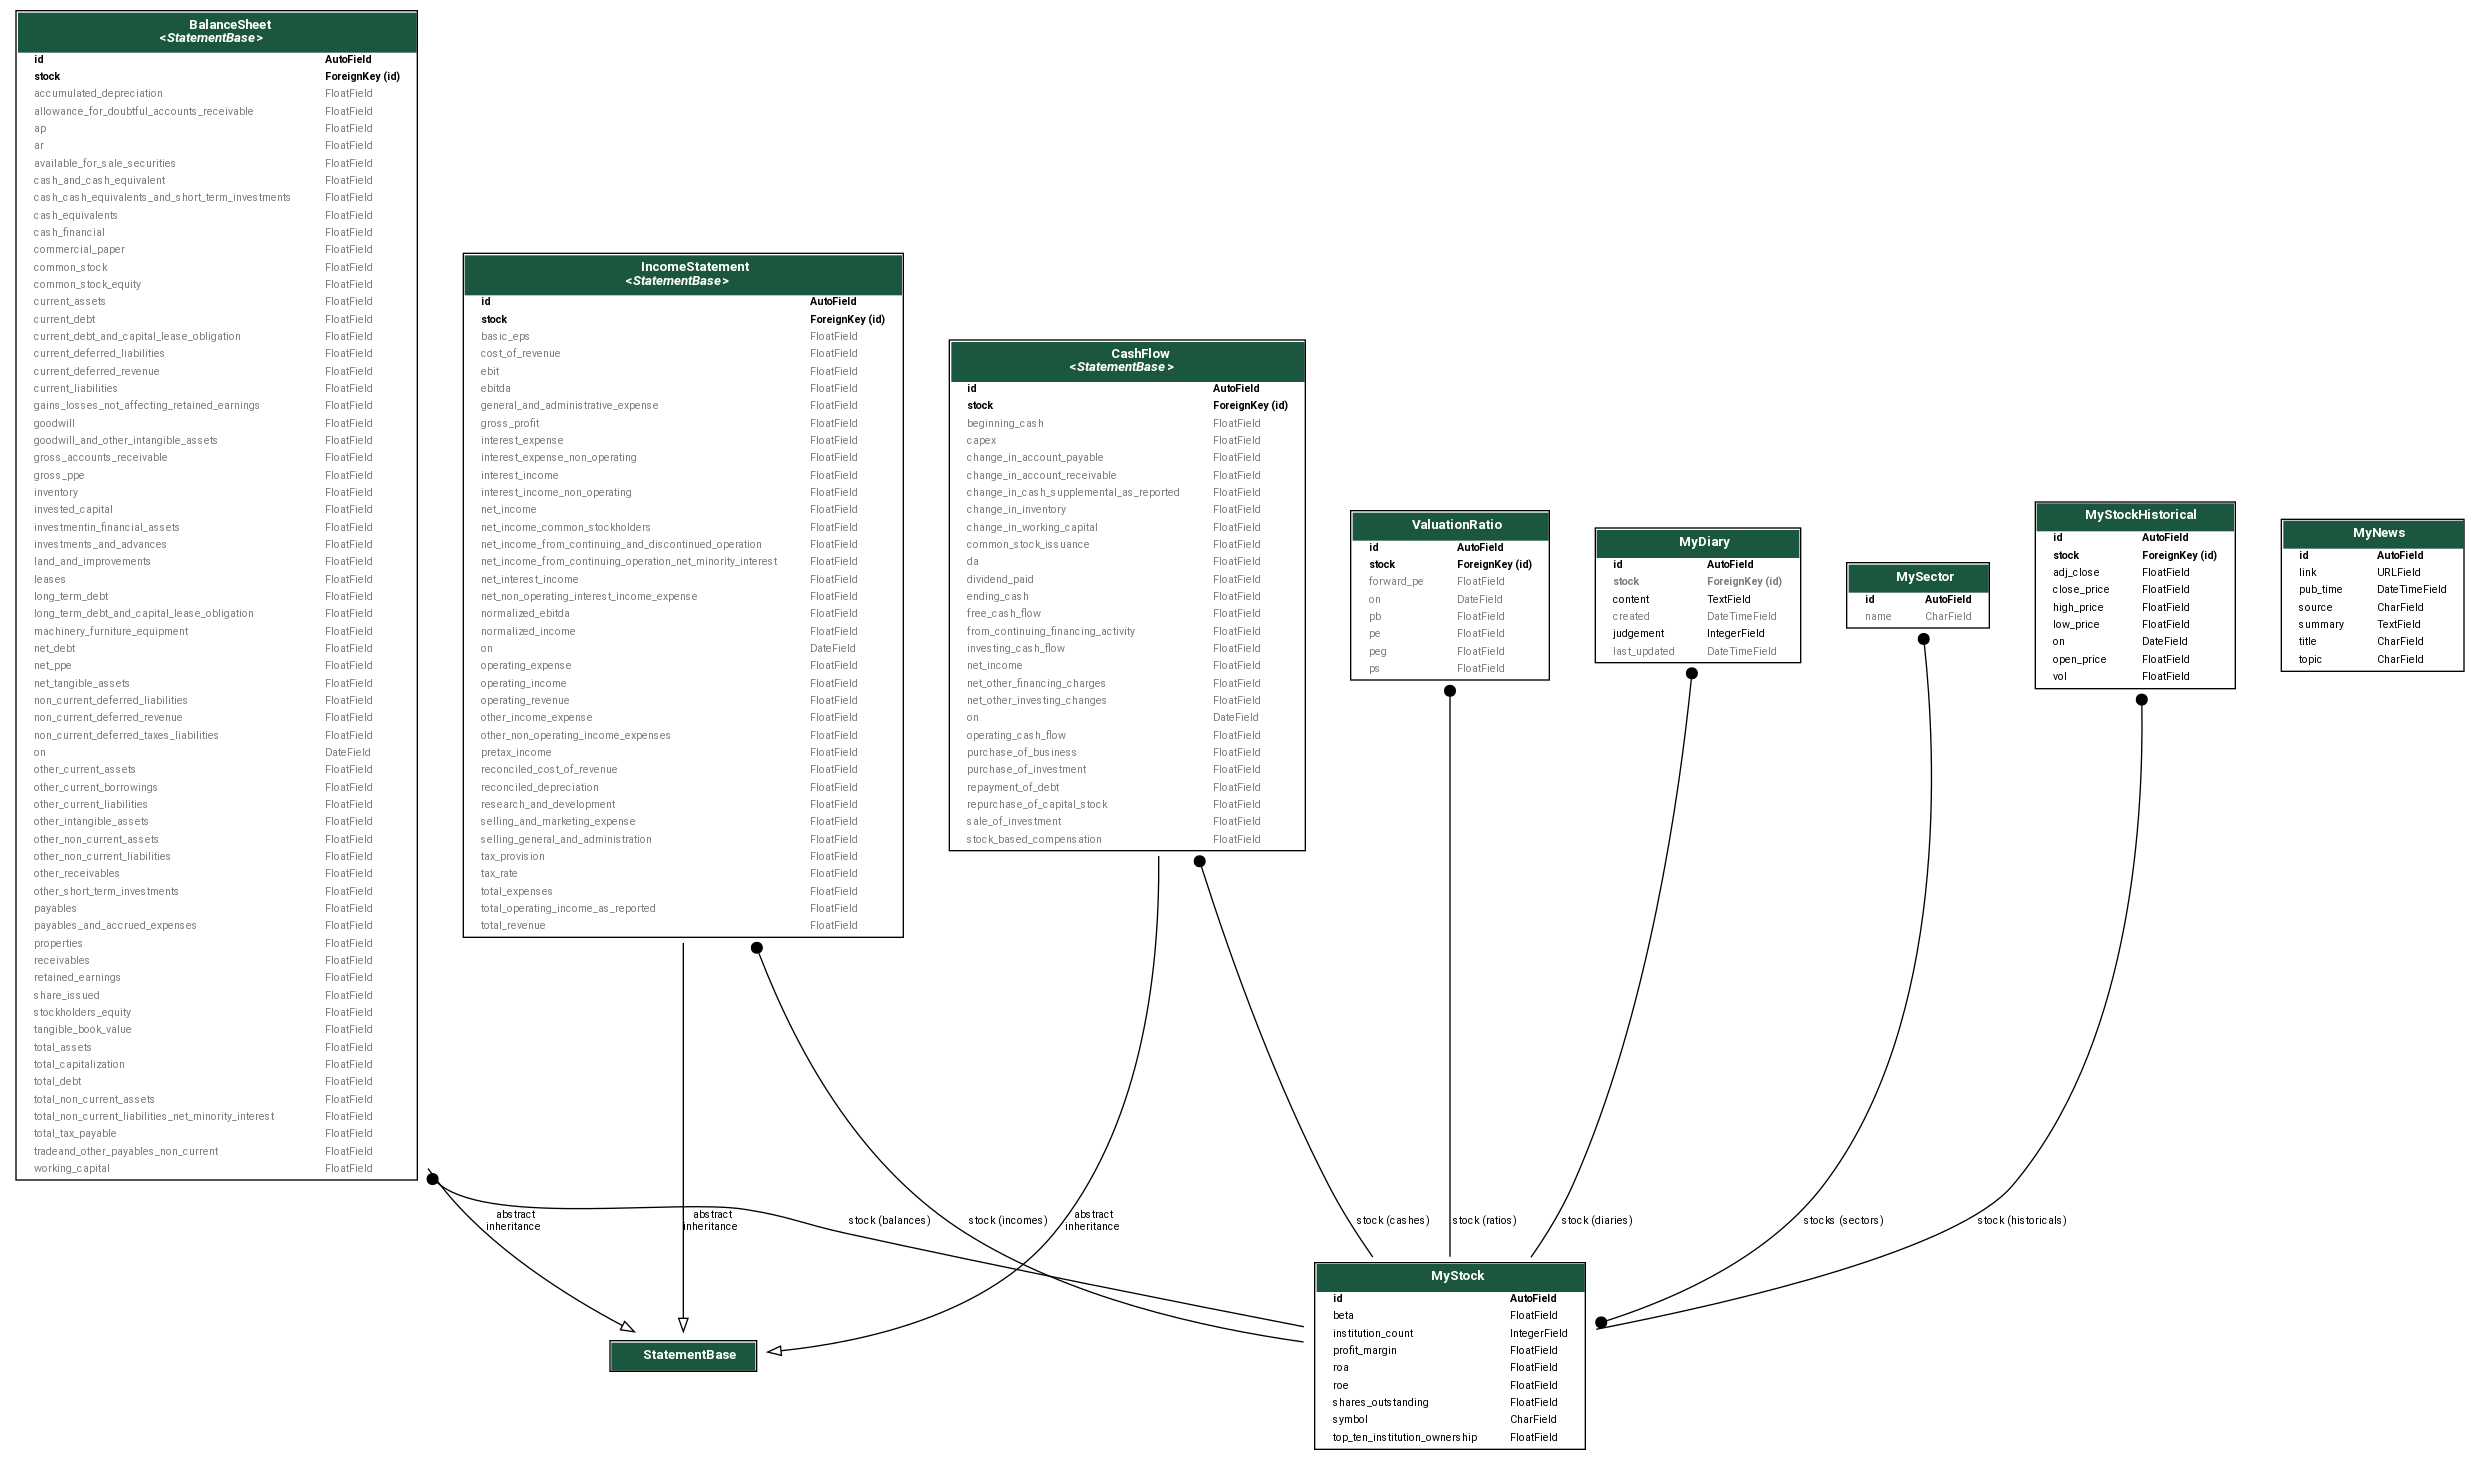
Data model
Model names are intuitive.
| Name | Description |
|---|---|
| MyStock | Place for name, symbol |
| MyStockHistorical | Daily trading data |
| MyStrategyValue | Pre-computed values based on historical, eg. moving average |
| IncomeStatement | As name |
| BalanceSheet | As name |
| CashFlow | As name |
| ValuationRatio | Published valuation ratios, eg. P/E. They are source dependent. |
Data persistence & processing
Data persistence is MySql 5.7. Using Django's ORM, this is not a hard requirement if your preference is something else.
Data processing is handled by Redis via Celery so to achieve ease of
scale. As mentioned earlier, MyStrategeValue are derived from
historicals, thus are computed prehand using this mechanism: Django
custom command → compose celery task → submit task to Redis
queue → task executed and data is persisted to DB.
There are also custom model property which is computed on the fly. Most of them can be pre-computed also since historicals are essentially static after a day. However, to minimize dependency on these values that must be prepared as a separate step, we opted to the current method. By observation, performance penalty by not having them in DB is acceptable.
Using docker, the following data volumes are used:
| Volume | Attach to |
|---|---|
| stock-data | Main DB data storage |
| redis-data | Redis data storage |
Develop & Deployment
See dev & deployment for details.
-
Some source provide indicators such as MACD. Most, however, only provide raw/reported data such as sales of an Income Statement. My goal, therefore, is to follow the conventional train of thought by converting these values into percentage, and some period-to-period change rate, and so on, which I found myself doing a lot whenever I receive an Excel full of numbers. ↩
-
This is a made up example for illustration purpose. ↩
— by Feng Xia