Financial statements are called fundamentals. It is outside the scope of this doc to explain what these statements are and how to read them. As stated in the design, the reported values were often found less useful without computing a ratio, a percentage, or period-to-period comparison. Therefore, this tool takes on the data crunching by providing such computation and comparisons.
Four data categories
This is applicable to all three statements. On each page one would find data grouped into four categories:
- reported: These are straight out-of-report numbers. NOTE
that units are often omitted and a unit of billion is
implied. For example, shared issued of
17.14would be 17.14 billion shares, whereas working capital of44.75would be 44.75 billion dollars. - ratio: Ratios are common technique in financial statement analysis. We have covered many of them so far, and the list will continue to grow w/ newer releases.
- period-to-period growth rate (%): Using quarterly statement data provided by the Yahoo! API, we picked some data points to compute its growth rate from quarter to quarter. NOTE that all the data points on a statement can be subjected to this calculation. However, we have limited the list on purpose, and will consider to expand this list in the future.
- A-over-B as %: This is another common technique to establish a relative position between two values. For example, what percentage is the administrative expanse (A) over sales (B)1?
Normalized comparison chart
When we analyze financial statement, the number itself isn't
interesting. It is their relative position and trend what we are
really after. Therefore, we applied normalization — taking
the first value as the base, then divide the rest of the data each
to the base. Thus, an array [2,3,4,5,6,...] would produce a base of
2, and the normalized array would be [1,1.5,2,2.5,3,...].
Now w/ normalized data, we could put data points side-by-side to see which is rising and which is falling at the same time, and who is rising/falling faster2.
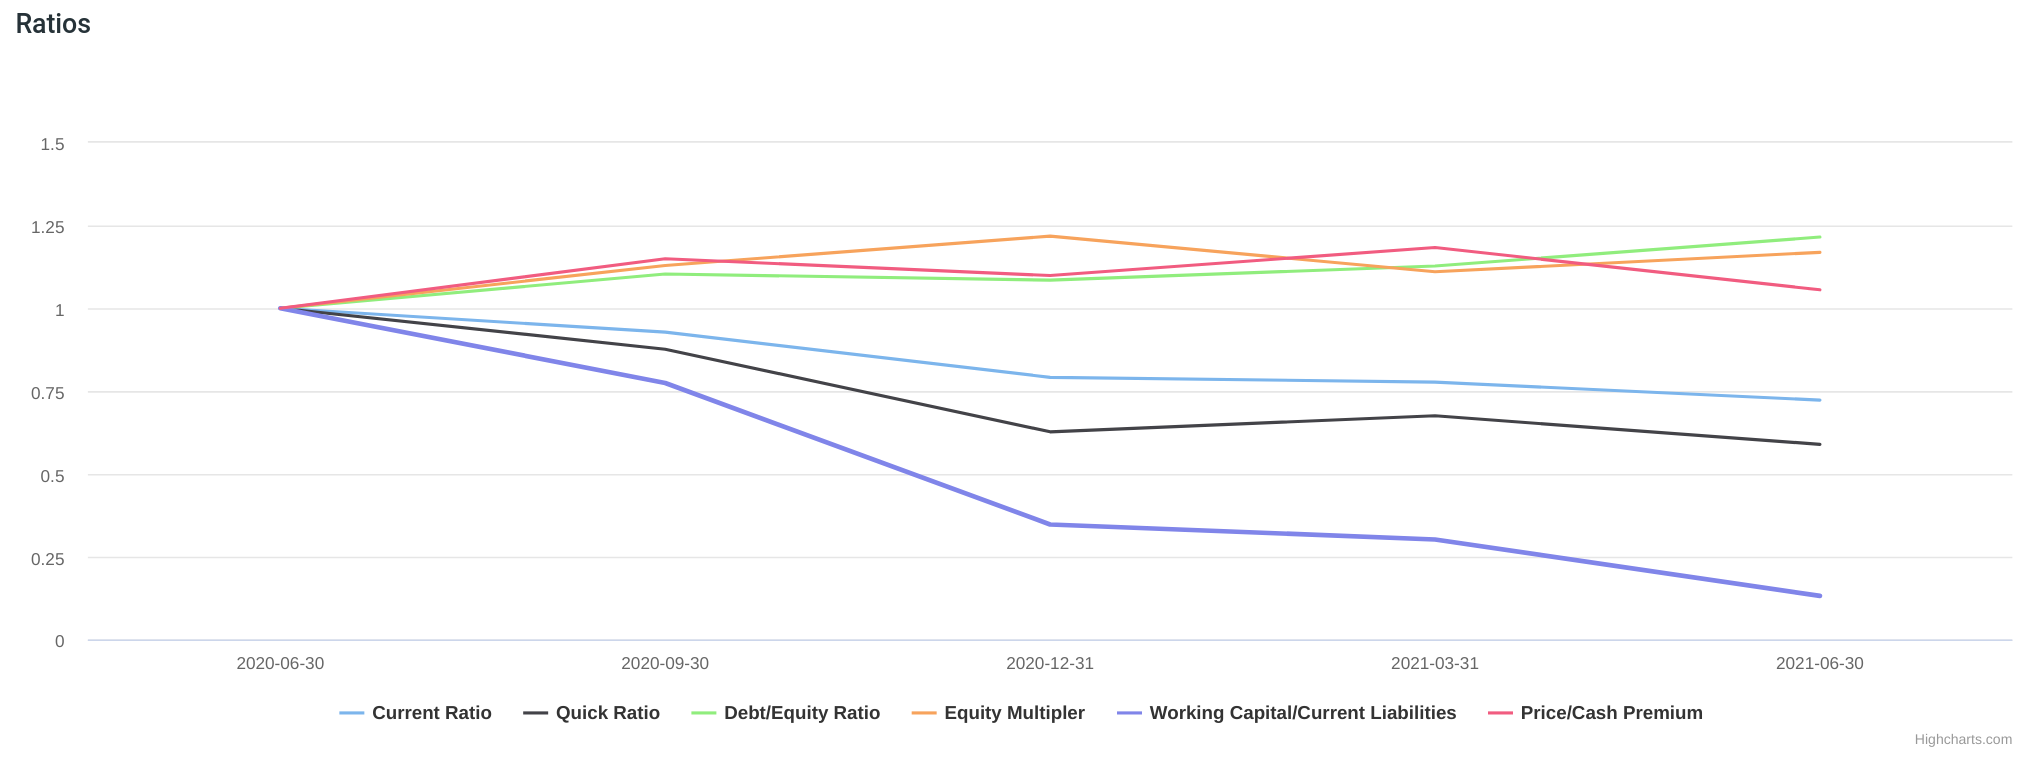
In this example, both the working capital(purple) and quick ratio(black) were deteriorating over time while the working capital fared worse as it had a sharper slope.
Balance Sheet
Reported
| Data | Calculation |
|---|---|
| Share Issued | as is |
| Common Stock | as is |
| Retained Earnings | as is |
| Cash & Equivalents Per Share | (cash & cash equivalent)/(share issued) |
| Working Capital | as is |
| Invested Capital | as is |
| Tangible Book Value Per Share | (tangible book value)/(share issued) |
Ratios
| Data | Calculation |
|---|---|
| Current Ratio | current assets/current liabilities |
| Quick Ratio | see below |
| Debt/Equity Ratio | total debt/stockholders equity |
| Equity Multiplier | total assets/stockholders equity |
| Working Capital/Current Liabilities | working capital/current liabilities |
| Price/Cash Premium | cash and equivalents per share/latest close price |
- Quick ratio:
(cash & equivalents & short-term investments + 50% of
   account receivable - inventory)/(current liabilities)
. NOTE that we take into account for a 50% account receivable loss. We are also assuming a total loss of inventory. - Price/Cash Premium: Can the company redeem today's
closeprice w/ nothing but its cash!? This is a what-if analysis if stock investors were to take higher priority than creditors if the company went belly up today ~~
Period-to-Period Growth Rates (%)
| Data | Calculation |
|---|---|
| Shares Issued | (this period - last period)/last period |
| Equity | same |
| Debt | same |
| Account Payable | same |
| Account Receivable | same |
| Cashes | same |
| Working Capital | same |
| Invested Capital | same |
| Net PP&E | same |
A-over-B as %
| Data | Calculation |
|---|---|
| Capital Structure | total debt/total assets |
| Total Liabilities/Total Assets | as name |
| Current Assets/Total Assets | as name |
| Retained Earnings/Equity | retained earning/stockerholders equity |
| Inventory/Current Assets | as name |
| Cash Equivalents/Current Assets | cash & equivalents & short-term investments/current assets |
— by Feng Xia