There are three types of return: daily, nightly, and 24-hour. Return values are in percentage (%), and negative returns are colored in red. Since the analysis done to them are similar, we are to address them together here.
- daily return:
(today's close - today's open)/today's
   open
. This measures the return during normal market hours. - nightly return:
(today's open - yesterday's close)/yesterday's
   close
. This measures the return during off market hours. - 24-hour return:
(today's close - yesterday's
   close)/yesterday's close
. This measures the over effect of a 24-hour day, thus including both the market hours and off market hours (for example, many companies choose to make announcement after market close, thus causing price to fluctuate prior to next day's market opening).
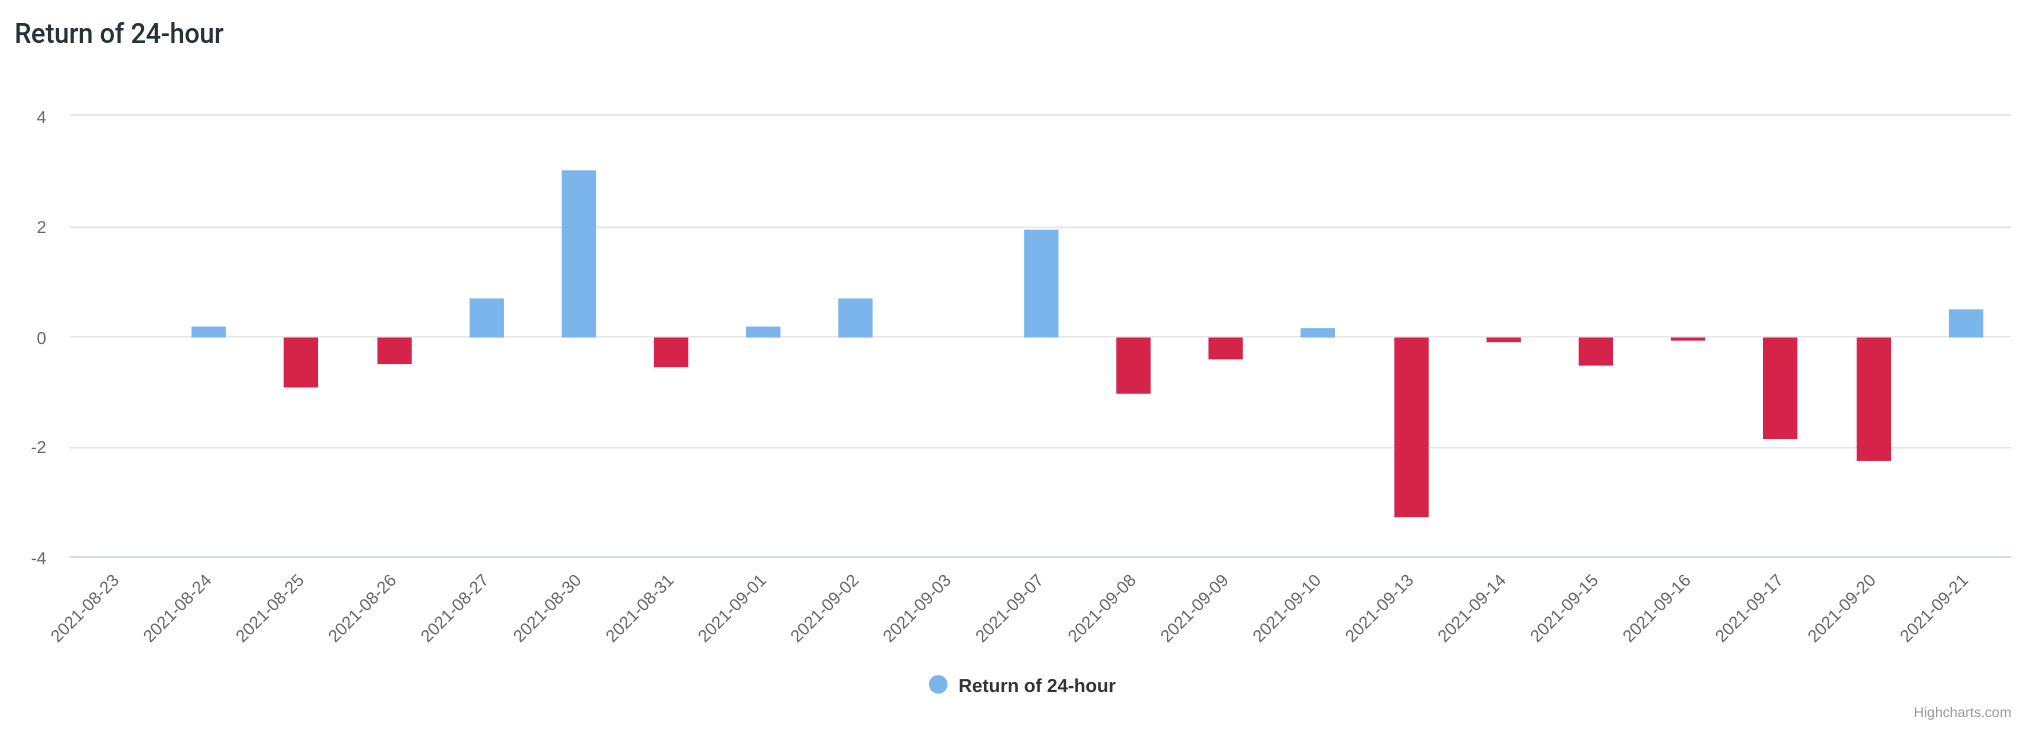
Now with computed returns, we do some basic counting and statistic analysis of the return data.
positive vs. negative occurrence
This answers that out of the return data, how many were positive and how many were negative. If a stock were on a rise, we would expect it having more positive days than negative ones. However, this takes no account for the scale of each positive/negative return.

In this example, this stock has had 40% positive days vs. 60% negative days. One would thus think it wasn't performing well over this period.
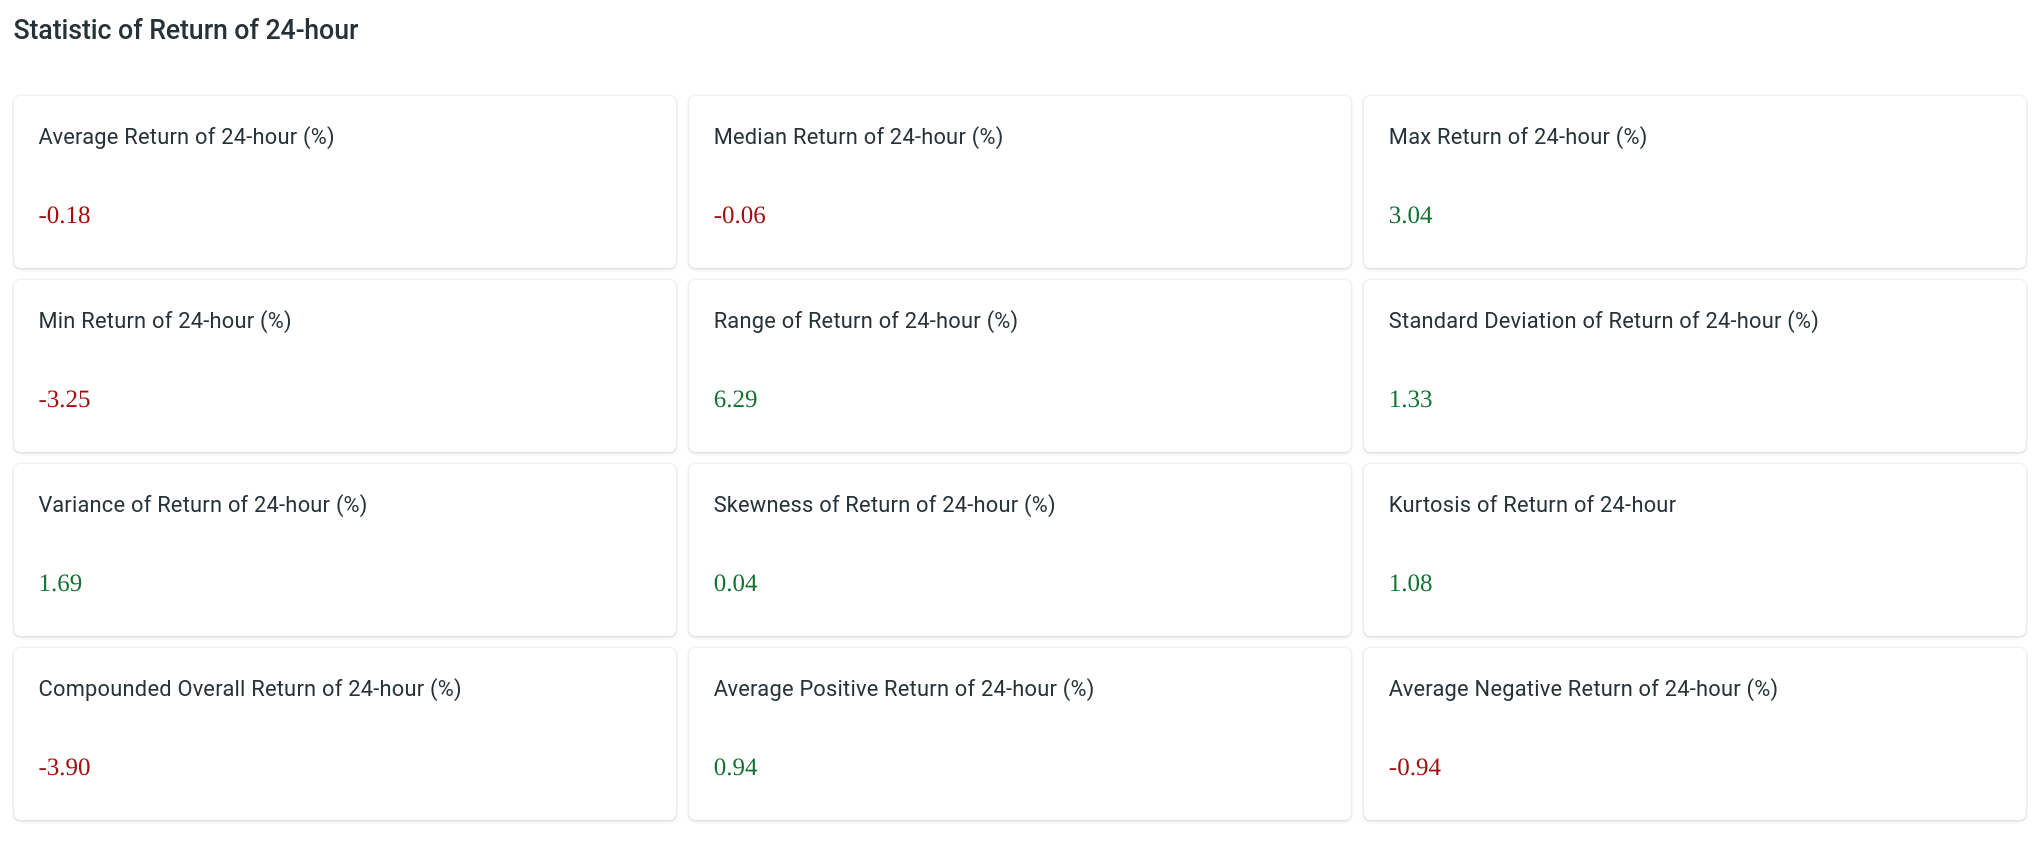
return statistics
These are some common statistic values computed over the return data, including average, max, min, median, standard deviation, range of, variance, skewness, Kurtosis, average of positive returns, average of negative returns, and compounded return (= product of all returns).
— by Feng Xia