Technical analysis is mainly based on react-stockcharts. We currently support the following indicators: Bollinger Band, Elder Ray, SAR, Full Stochastics Oscillator, Heikin-Ashi, MACD, and Relative Strength (RSI). More indicator visuals will be added in future.
Date range
User can set a date range by using the date picker. Default end date is TODAY, and start date is 1-month from TODAY. Depending on the indicator, this default date range may not provide enough data points for the analysis, thus the first appearance of the chart may look incomplete. In this case, user should adjust the range to provide more data points. Graph will refresh automatically when date range is changed.
NOTE that switching between indicators will reset the date range.

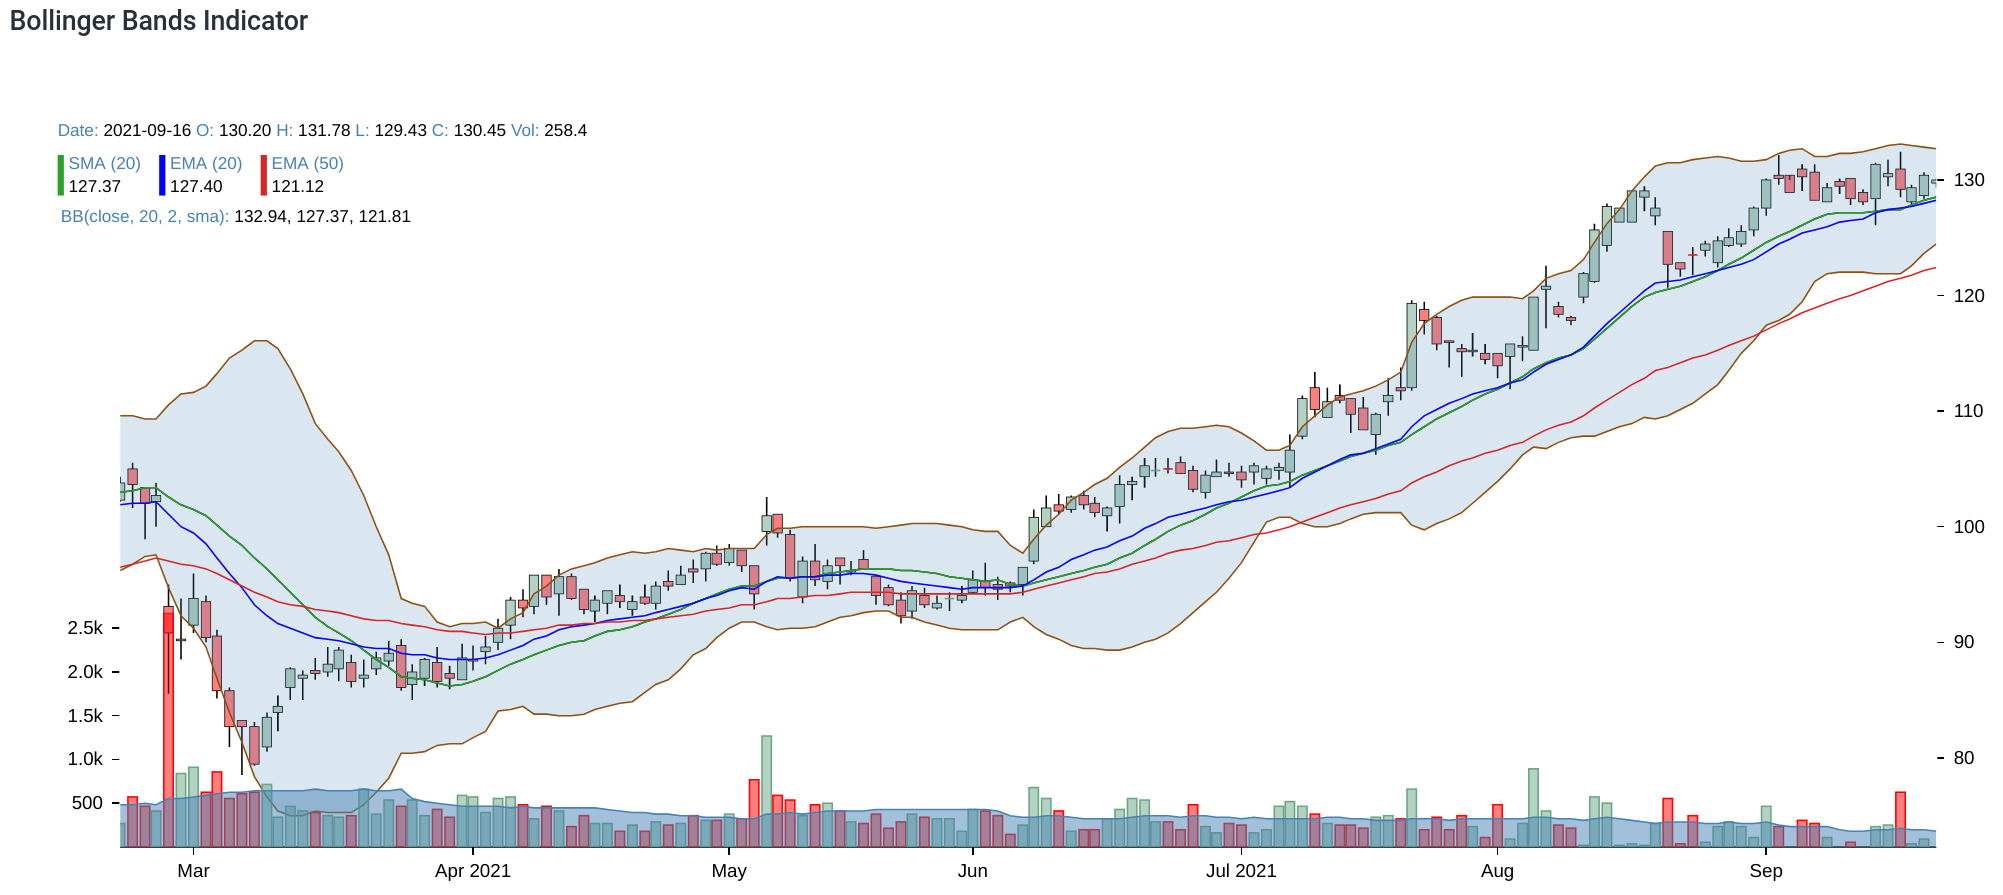
Bollinger Band
See wiki.
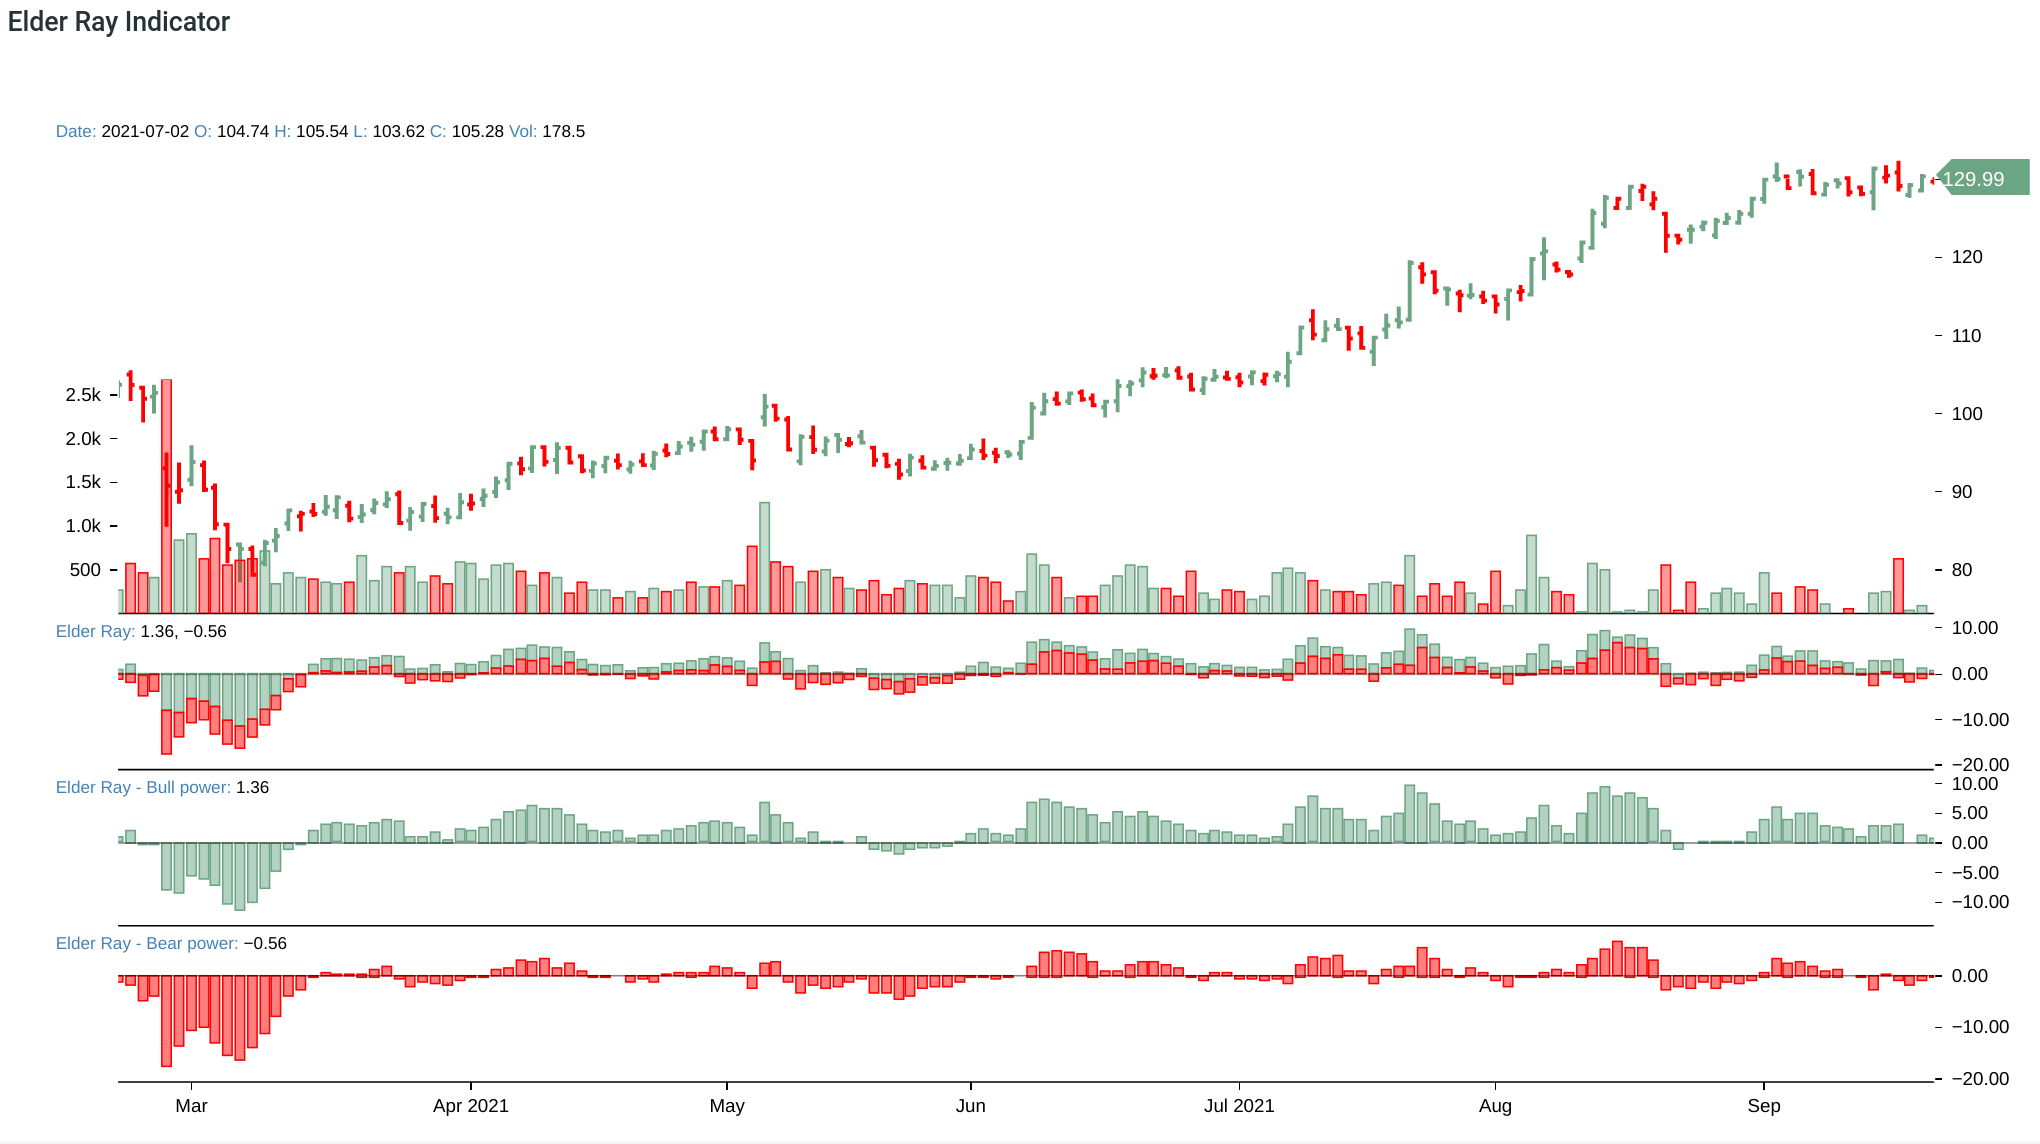
Elder Ray
See intro.
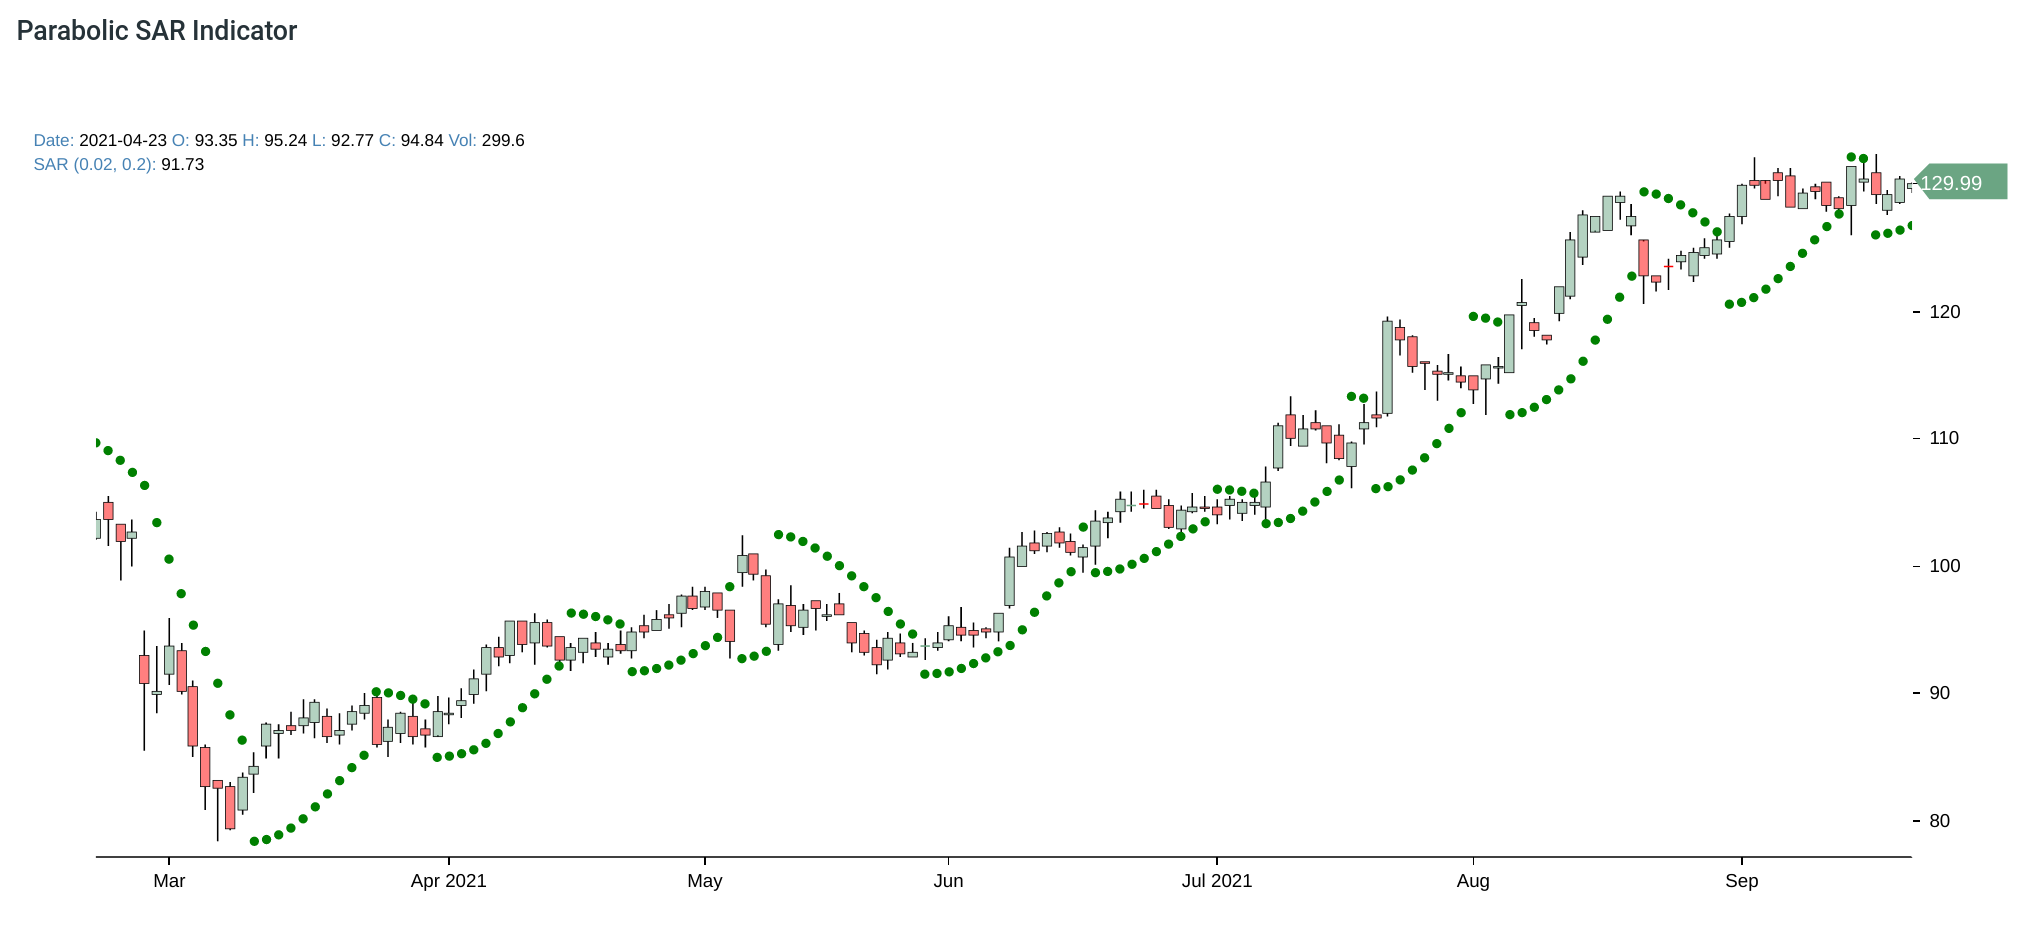
SAR
See wiki.
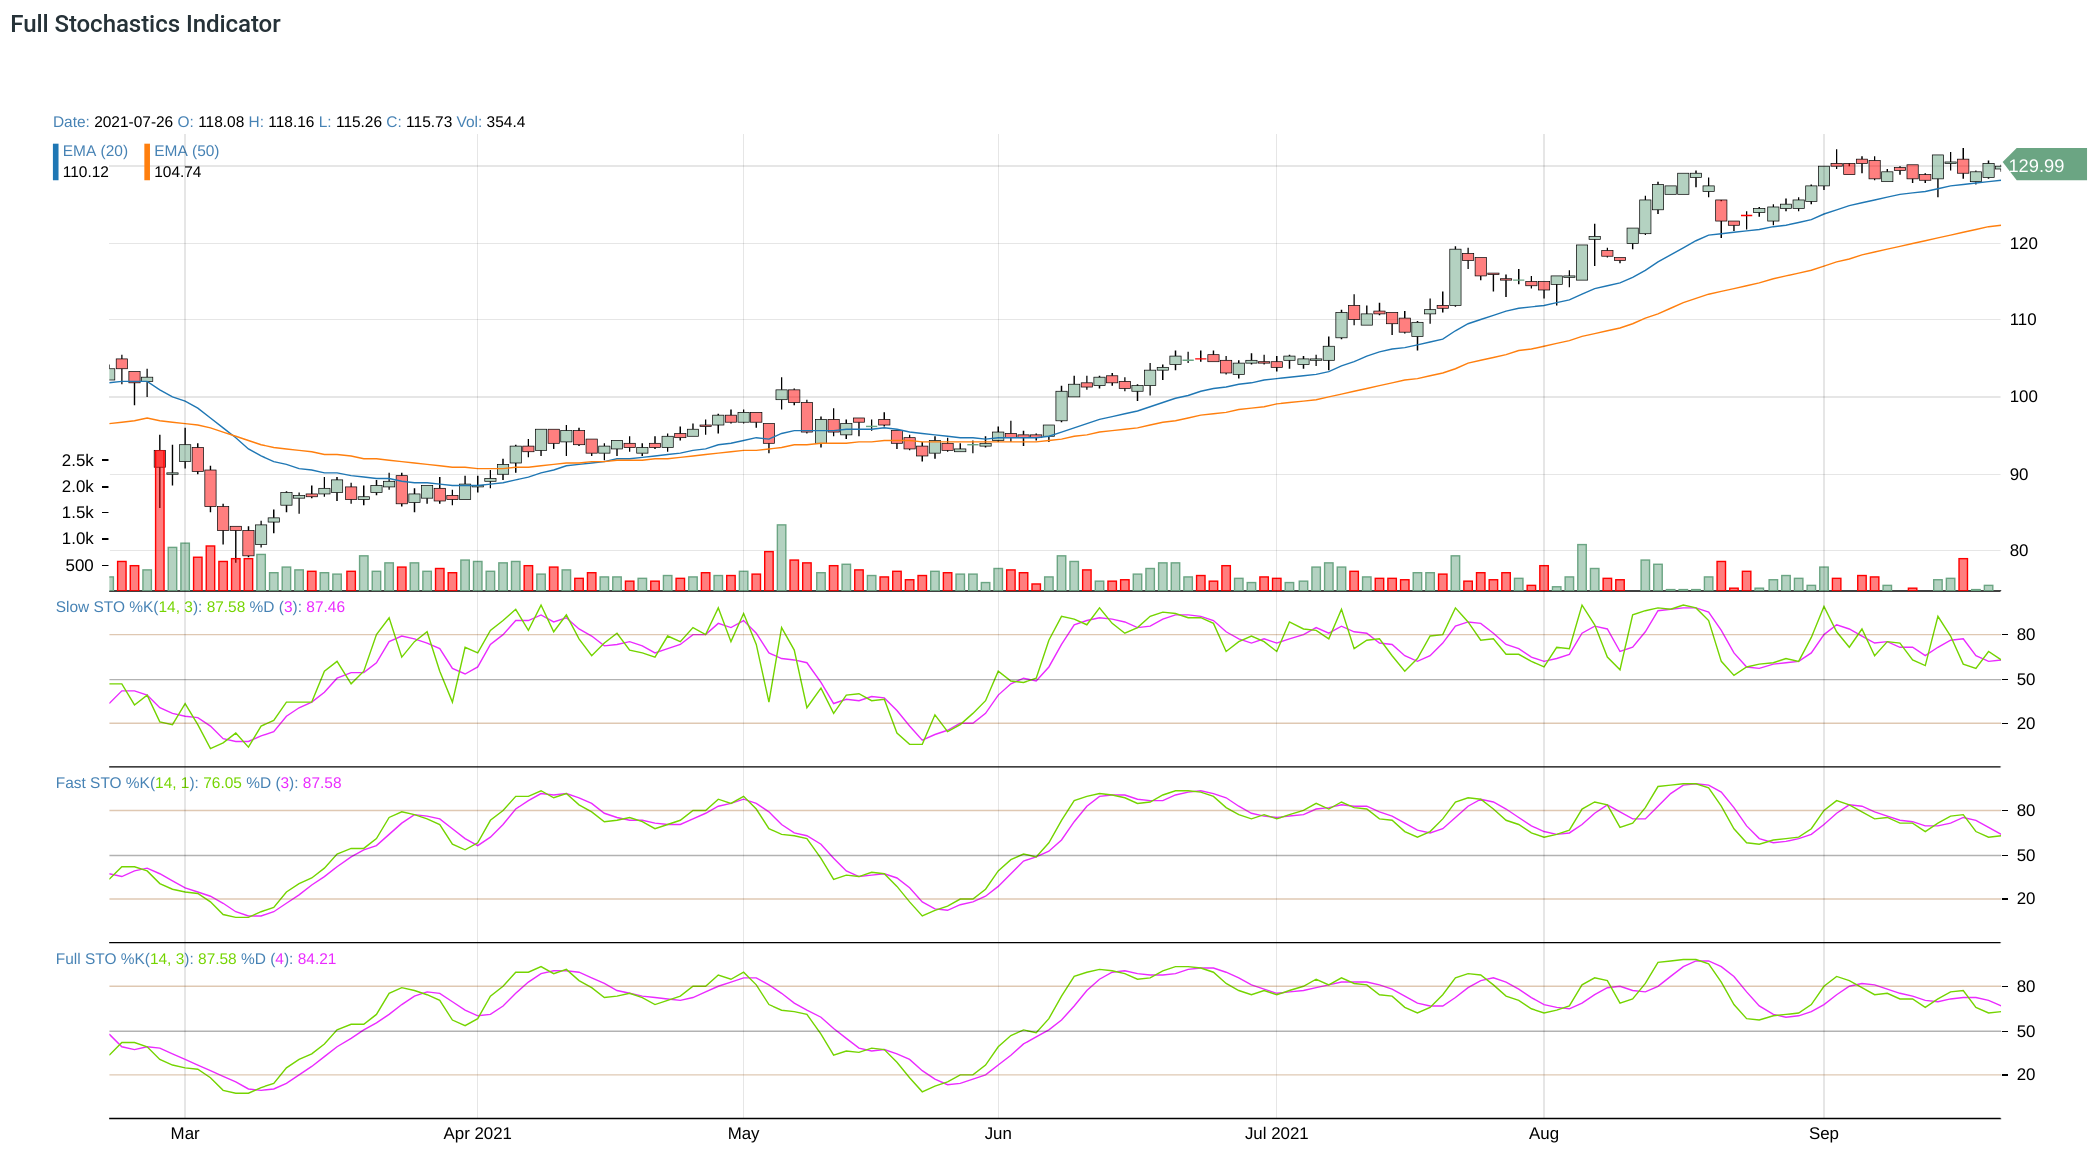
Full Stochastics Oscillator
See wiki.
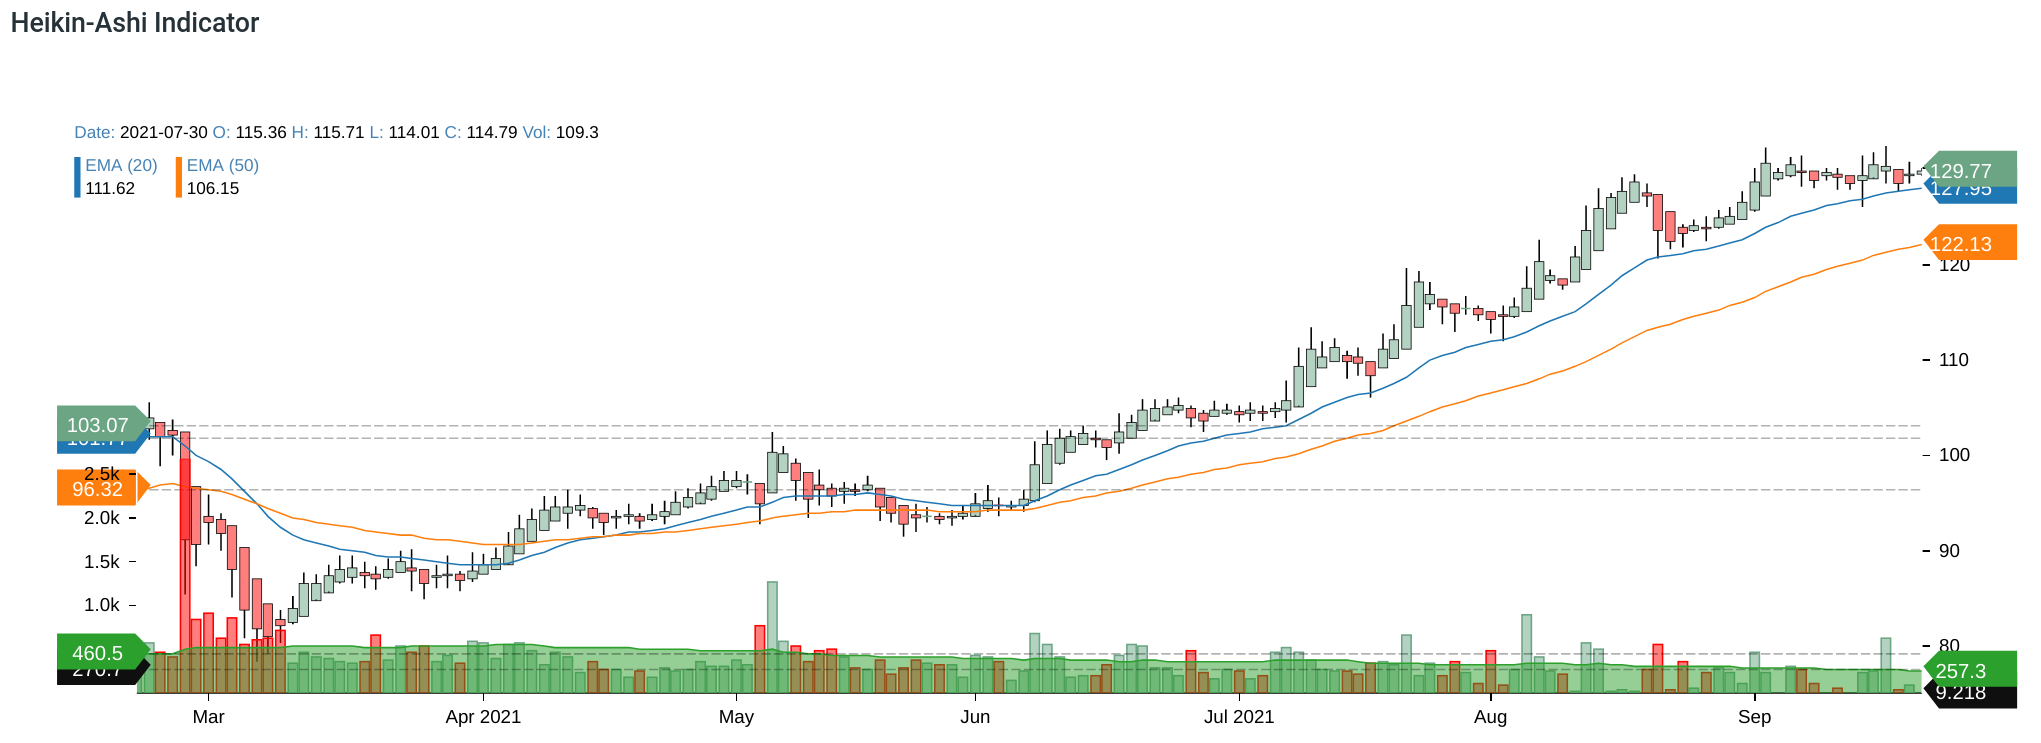
Heikin-Ashi
Read here.
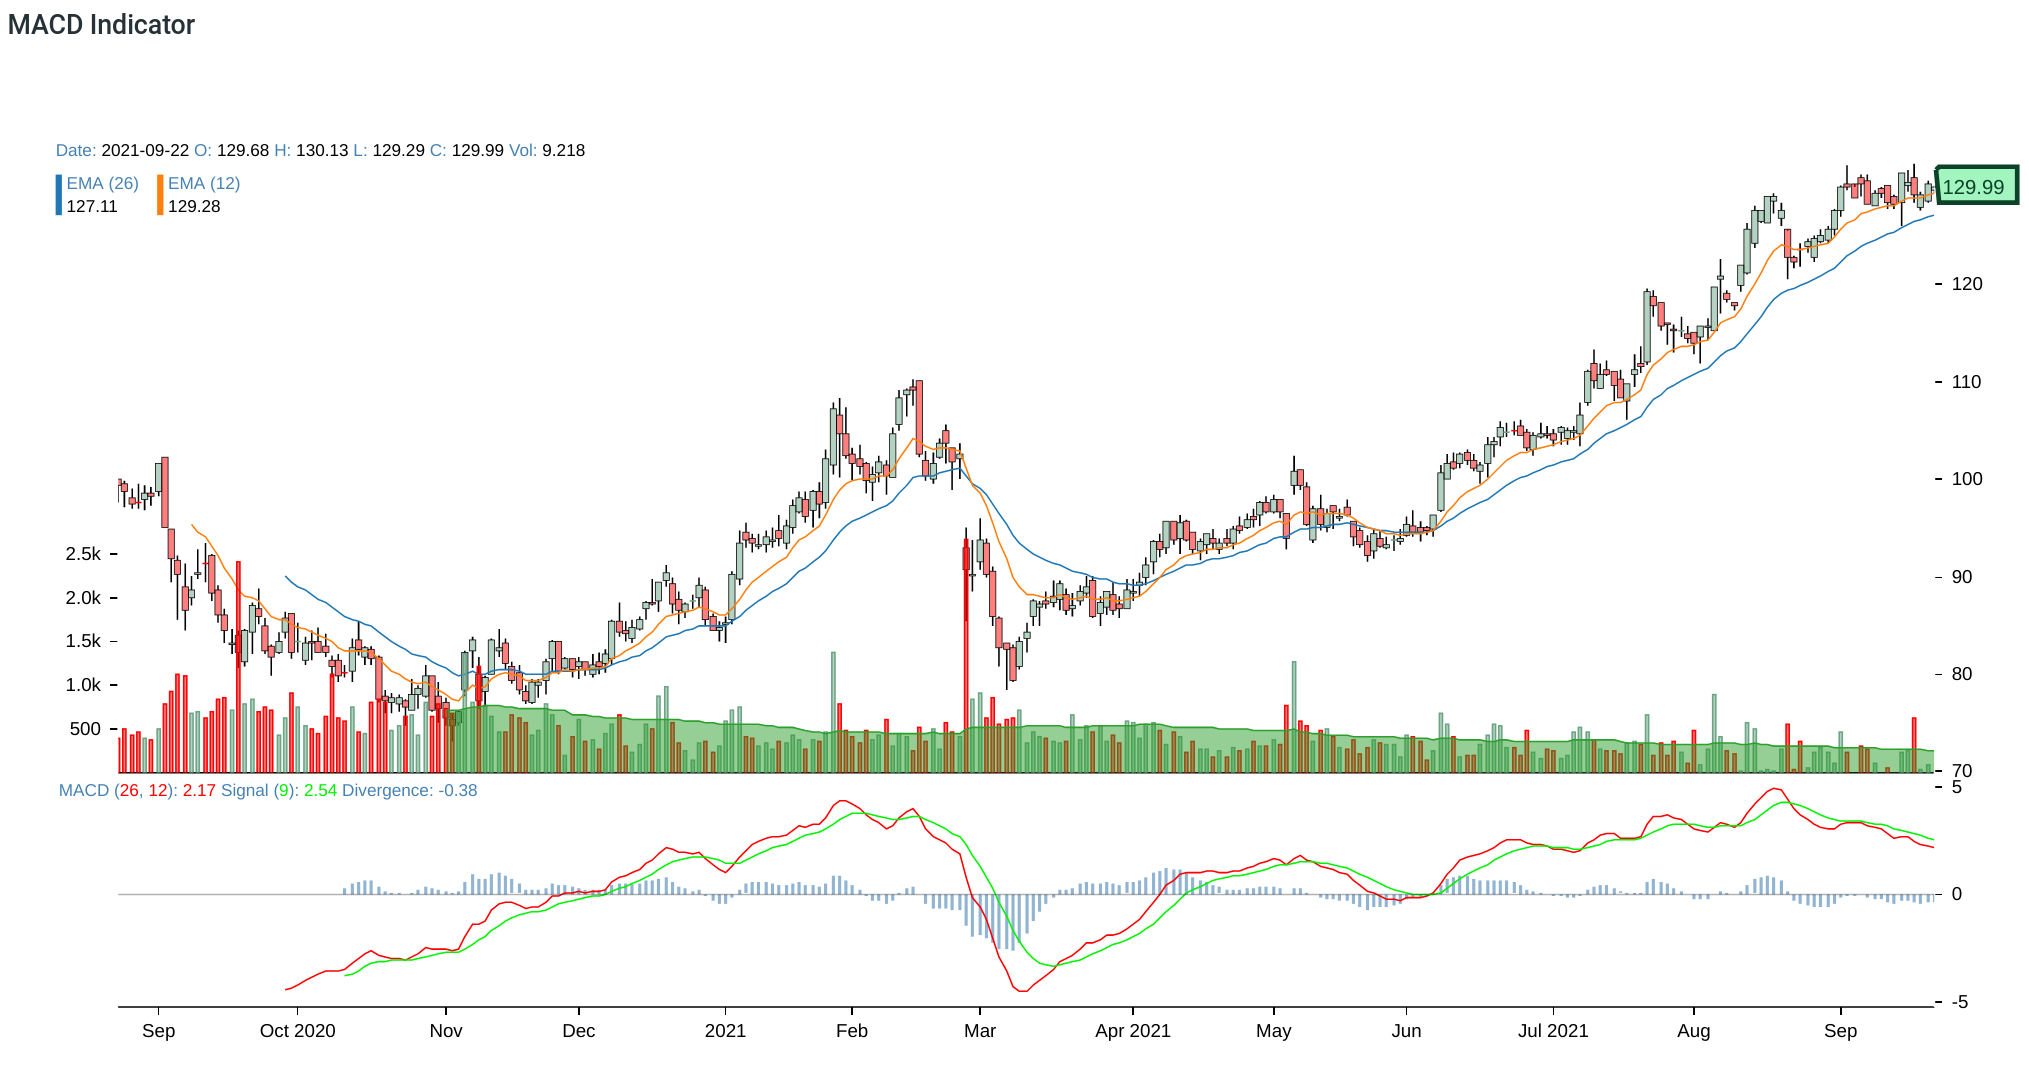
MACD
See wiki.
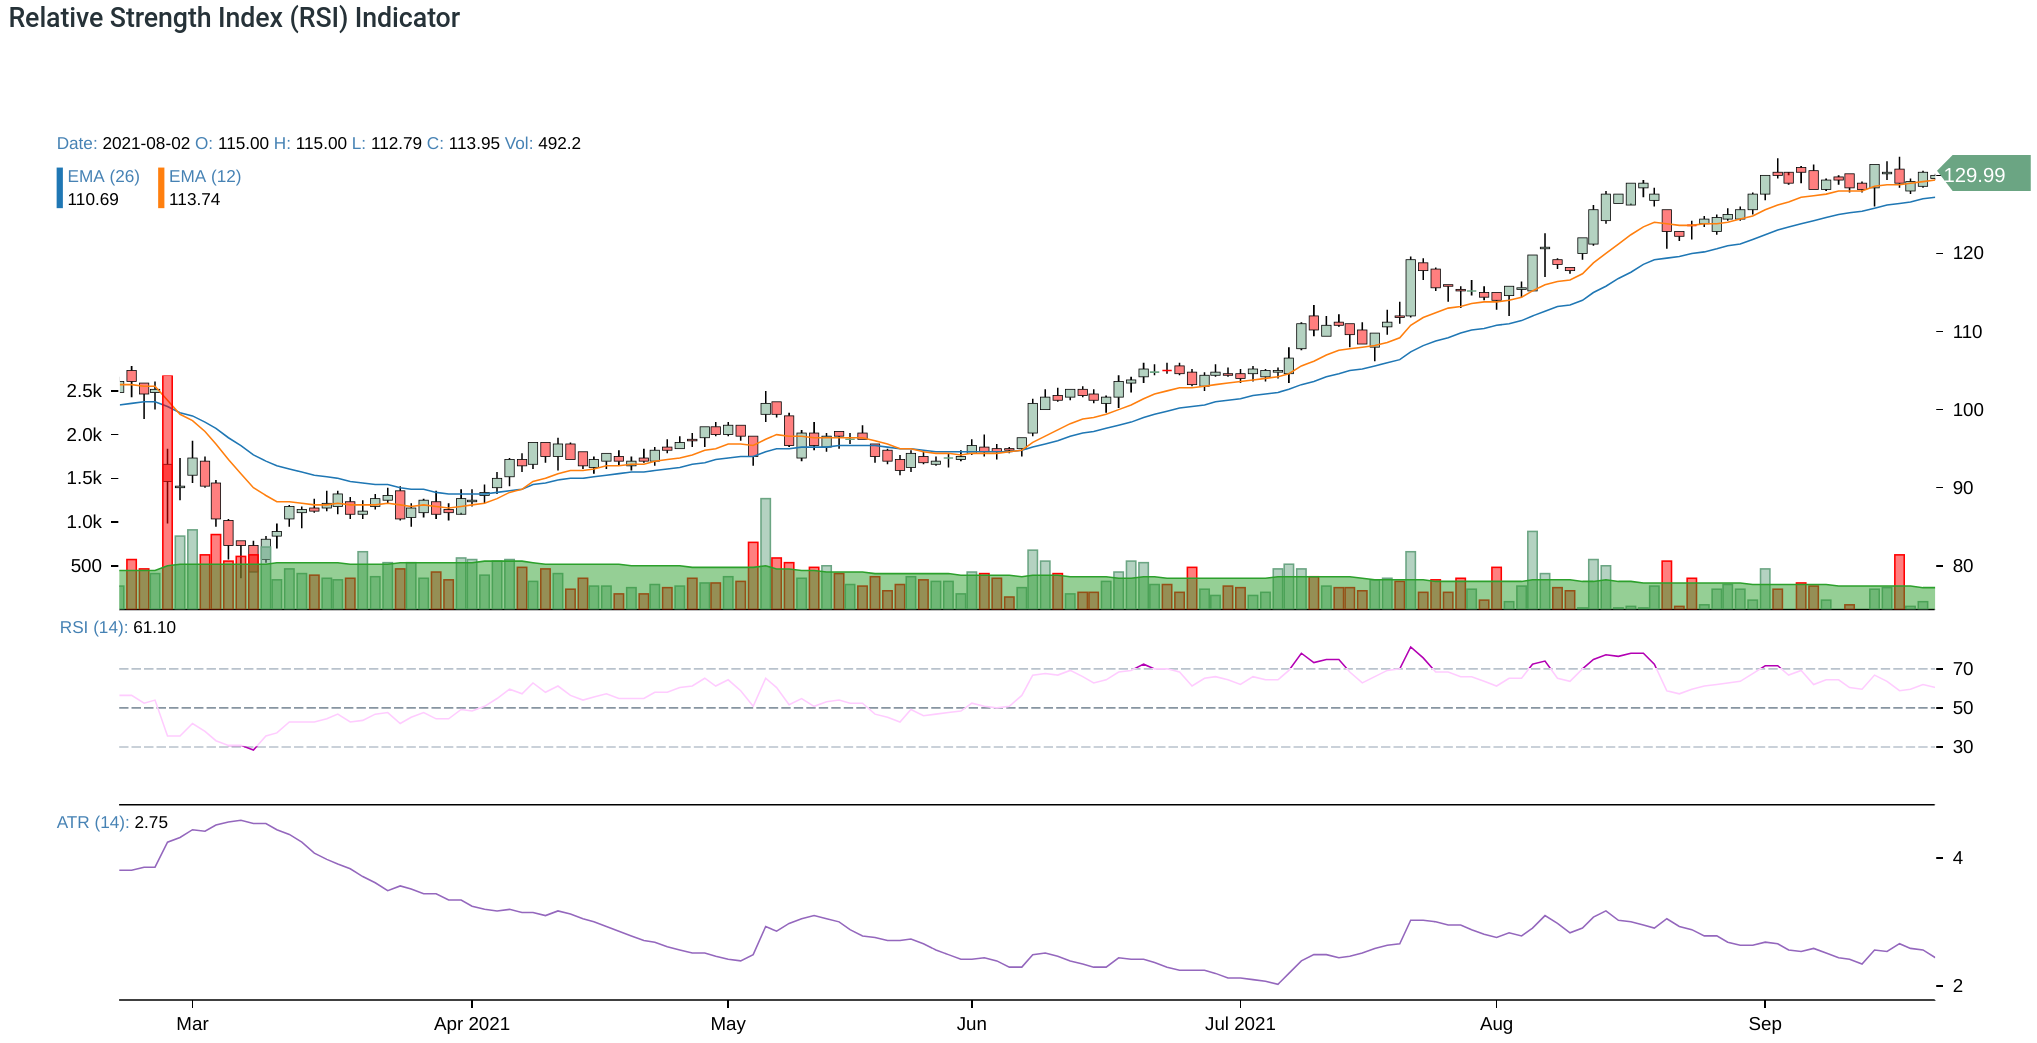
Relative Strength (RSI)
See intro.
— by Feng Xia