CAT: misc
Price Trending
Trending function is a unique feature we don't find in other tools. The idea is: if I could rank the stock's performance, how to see this performance changes over time? If ranking was a snapshot in time based on the latest data available, trending now introduced a time line which makes the comparison much interesting.
Trending Values
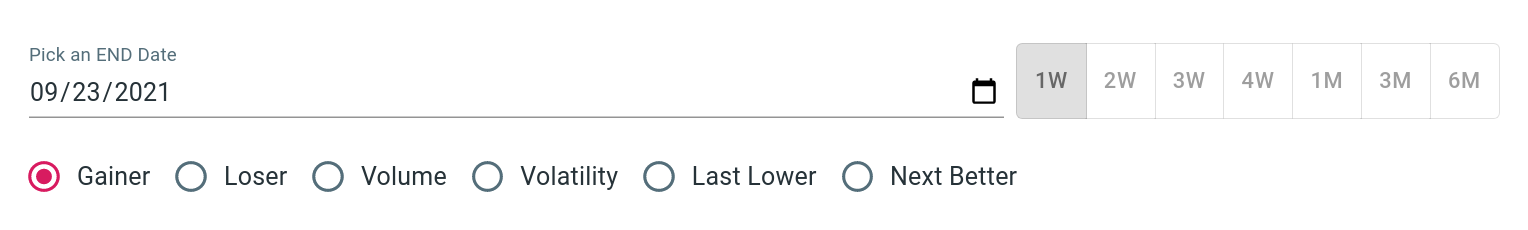
We provide trending on these indexes:
| Value | Description |
|---|---|
| Gainer | positive daytime return % |
| Loser | negative daytime return % |
| Volume | reported volume/share outstanding |
| Volatility | (high-low)/low |
| Last Lower | see stock trend |
| Next Better | see stock trend |
User can set a date range by changing the end date (default to
TODAY), and how far back he wants to go (default to 1 week).
Top Ranks
Top ranks show ranks of each day based on selected value index and the time period. There are two types of view we provide: a static/matrix view, and a race chart.
Matrix view
The matrix view shows the ranks in a grid. Each column represents a date. Dates are arranged in order with …